
Official websites use .gov
A .gov website belongs to an official government organization in the United States.
Secure .gov websites use HTTPS
A lock (
) or https:// means you’ve safely connected to the .gov website. Share sensitive information only on official, secure websites.
PerfLoc User Guide
perfloc navigation
- PerfLoc: Performance Evaluation of Smartphone Indoor Localization Apps
- User Guide
- FAQs
- Data
- Archived Announcements
- Back to Location-Based Services portfolio page
Introduction
Indoor localization is a popular field of research due to the increasing need for navigation and context-awareness inside buildings. Scientists are working to enable commonly used smartphones to determine/estimate the locations of their users indoors. One challenge that the researchers and developers encounter is testing of their systems. Many of them use modeling and simulation or they can afford only a small set of measurements in the specific buildings that they have access to.
In this project, we aim to provide algorithm developers an extensive data set to test their algorithms on. This document provides the necessary information and guidelines to understand and use the collected data.
The data is composed of:
- RF signal strengths measured from Wi-Fi access points in range
- RF signal strengths measured from cellular towers (base stations) in range
- Built-in environmental, position and motion sensors
- Detected geophysical position using the Global Positioning System (GPS)
- Timestamps at certain test points (dots) in the buildings with known x,y,z coordinates
- Metadata involving the features of the device that was used to collect a data set corresponding to a particular Test & Evaluation (T&E) Scenario and the air pressure value at the beginning of the scenario, whenever applicable.
- Building-specific information comprising the coordinates of the corners of each building, the coordinates of Wi-Fi access points (APs) deployed in the building, and the coordinates of the training dots in that building
- Definitions of protocol buffers; see the end of this section for more information on this item.
The data was collected using four different smartphones, in four buildings with different characteristics. The total space covered by these buildings was about 30,000 m2. One was an office building, two were industrial shop and warehouse types of buildings, and the fourth was a subterranean structure. More than 900 dots were used to mark locations of interest that covered all the spaces in all four buildings. A total of 34 T&E scenarios were used for data collection in the four buildings. Time instances were recorded in each scenario when certain dots were visited. The dots visited in each scenario were a subset of the dots deployed in the given building, and the subsets varied from one scenario to another within the same building. The T&E scenarios are defined in the ISO/IEC 18305 standard.
Each dot is a disk of about 3 cm in diameter with its center marked for subsequent surveying. The locations of these dots were precisely determined by a surveying contractor. Therefore, the ground truth locations of the dots are known to NIST.
In an effort to capture the differences in qualities of the sensors and RF circuitry in smartphones, we used the following four Android smartphones for data collection:
- OnePlus 2
- LG G4
- Motorola Nexus 6
- Samsung Galaxy S6
These devices are a few of the state-of-the-art smartphones that were available in the United States and European markets in 2015. They feature different types of hardware and capabilities.
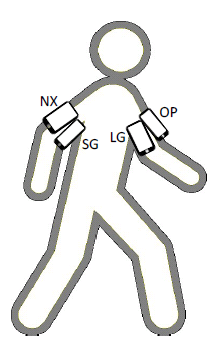
Since we did not want to repeat each data collection scenario four times, once for each smartphone, we devised a mechanism to collect data simultaneously with all four phones. We used armbands to attach two phones to each arm of the person collecting data. On each arm, one phone faced forward and the other faced to the side away from the person. We connected four cables in parallel to a push-button switch. The other sides of the cables were connected to the audio jacks of the four phones. We used this mechanism to send a signal to the phones to create a timestamp in each of them whenever the person collecting data was on top of a dot and pressed the push-button switch. The phones were attached to the arms of the person collecting data according to the following configuration:
- Left arm outside: OnePlus 2
- Left arm forward: LG G4
- Right arm outside: Motorola Nexus 6
- Right arm forward: Samsung Galaxy S6
The data that we collected is described in detail in the next section. We collected two types of data, one for training and the other for testing purposes. The data in each type is timestamped, but the training data is also annotated with the ground truth locations of the dots at which the push-button switch was pressed. The training data will allow the app developers to check how well their apps are performing by comparing the location estimates provided by their apps at the time instances when the push-button switch was pressed with the ground truth locations at those time instances. In the case of the test data, the ground truth locations, at the time instances at which the push-button switch was pressed, are not provided to the app developers.
Each scenario called for the person collecting the data to start at a given location outside a building before entering the building and following a predetermined course while pressing the push-button switch at select dots on the course.
The scenarios involved different modes of mobility:
- walking to a dot and stopping for 3 s before moving to the next dot;
- walking continuously and without any pause throughout the course;
- running / walking backwards / sidestepping / crawling part of the course;
- "transporting" the four phones on a pushcart;
- using elevators, as opposed to stairs, to change floors;
- leaving the building a few times during a scenario and then re-entering through the same door or another.
For each scenario in each building we generated six types of data on each smartphone: Dots, Wi-Fi, Cellular, GPS, Sensors, and Metadata. This data is stored as one or more Google Protocol Buffer Messages (PBMs) in a separate file for each data type.
All of the data files are serialized into the file system as "size delimited binaries" using the writeDelimitedTo method of Protocol Buffers' Java interface. Therefore, these files can be easily unserialized using the same interface's parseDelimitedFrom and parseFrom methods.
Measurement Runs and the "Data"
A "measurement run" refers to the process of collecting data in a specific building, following a specific T&E scenario of the ISO/IEC 18305 standard using four smartphones at the same time.
For each measurement run in a specific building, a movement path passing through a subset of the dots in the building was designed and the smartphones were moved along those dots. As precisely as he could, the person collecting the data pressed the push-button switch when he reached a dot to create timestamps in the phones to indicate the phones were at a particular dot. (There was probably a half meter error for just one scenario out of 38 that involved running.)
Each scenario started outside the building after a GPS fix was obtained. The start of a scenario was indicated by timestamping a virtual dot, denoted by Dot 0 in the data. Right before the start, the ambient air pressure sensor (barometer) was measured and included in the scenario metadata file along with other information.
The collected data are stored as size-delimited Google protocol buffer messages. Each type of information is stored in a separate file. All filenames are constructed with a prefix, the type of measurement data it contains, and a file extension, as in: {prefix}_{data type}.{suffix}
The prefix is composed of a building-identifier, a scenario-identifier, and a device-identifier, separated by a number of underscores ("_"'s). File extensions are ".pbs", which stands for "protocol buffer serialized". This is a non-standard file extension.
The building-identifier is composed of the letter "B" followed by a single digit (1-4) representing the building number. The scenario-identifier is composed of the letter "S" followed by two digits representing the scenario number, with "00" used for training data sets.
The device-identifier is a string composed of the smartphone manufacturer, brand, with "_"'s used as delimiters. It is generated with:
device_identifier = Build.MANUFACTURER + "_" + Build.MODEL + "_" + Build.BRAND;
For example, the LG G4 phone in Building 2 for Scenario 12 generated a file for Wi-Fi data with the name:
B2_S12_LGE_VS986_lge_WiFi.pbs
Likewise, the Samsung phone generated the following file for the Sensor data:
B2_S12_samsung_SM-G920V_Verizon_Sensors.pbs
Types of Data
1. Dots
Timestamps at dots visited during a scenario are recorded in files whose names end with "Dots.pbs".
To make sense of the collected data, it is important to know where and when the data was collected. Therefore, several hundred "dots" were installed in each building that was used for data collection. These dots are floor markers that were randomly installed around buildings. Each of the dots has a unique ID. The dot ID is not stored in the "Dots.pbs" files, but rather a dot-index designating the order in which the dot was visited during a scenario and the timestamp for when the dot was visited are stored. Since each dot-index is timestamped, an app developer can be asked to submit the estimates for the locations of the dots generated by his/her app at the timestamps stored in the "Dots.pbs" files, in the order of the dot-index and timestamp.
The dot-indices are simply successive non-negative integers with 0 reserved for the starting point of the scenario, which may not be a dot, and 1 through n used for the n dots visited during the scenario after the starting location. For each dot-index, there is a timestamp that designates the time when that location was visited. For the scenario that required waiting for three seconds at each of the dots 1 through n, we stored two dot-indices and two timestamps. Specifically, for the ith dot, we used dot-indices 2i-1 and 2i for the time instances we reached that dot and we left it, respectively. Each dot-index is represented in a separate protocol buffer message with its index and timestamp.
Dots output:
Contains size delimited PBMs with sequentially incrementing dot-indices and the timestamps for when the dots were visited. The dot-index starts from 0, indicating the start of a measurement run. The name of this data file is {prefix}_Dots.pbs.
2. Sensors
Built-in environmental, position, and motion sensors that are found in smartphones are recorded in files whose names end with "Sensors.pbs".
The Android platform defines and supports a number of sensors, which are either hardware-based or software-based. Hardware-based sensors, such as accelerometer, magnetometer, or light, are physical components in the device. Software-based sensors, such as linear acceleration and gravity, are virtual sensors that derive their values from one or more hardware-based sensors.
The Android platform does not specify a standard sensor configuration. Hence, the manufacturers can choose any set of sensors to install in their devices. In our measurements we collected data from all of the sensors that were available on any given device.
Each time a sensor provides data, the values are given as a float array, regardless of the size of this data. The contents of the array were put into a single PBM as a repeated float value.
The list of Android-defined sensors, their descriptions, the size of their data, and whether they are hardware- or software-based are given in the Table below. http://developer.android.com/guide/topics/sensors/sensors_overview.html
| Sensor Type | Description | Value Size | Type |
|---|---|---|---|
| AMBIENT_TEMPERATURE | Ambient air temperature | 1 | Hardware |
| LIGHT | Illuminance | 1 | Hardware |
| PRESSURE | Ambient air pressure | 1 | Hardware |
| RELATIVE_HUMIDITY | Ambient relative humidity | 1 | Hardware |
| ACCELEROMETER | Acceleration force along the x,y,z axes | 3 | Hardware |
| GRAVITY | Force of gravity along the x,y,z axes | 3 | Hardware or Software |
| GYROSCOPE | Rate of rotation around the x,y,z axes | 3 | Hardware |
| GYROSCOPE_UNCALIBRATED | Rate of rotation (without drift compensation) around the x,y,z axes | 6 | Software |
| LINEAR_ACCELERATION | Acceleration force along the x,y,z axes (excluding gravity) | 3 | Hardware or Software |
| ROTATION_VECTOR | Rotation vector component along the x,y,z axes and Scalar component of the rotation vector | 4 | Hardware or Software |
| STEP_COUNTER | Number of steps taken by the user since the last reboot when the sensor was activated | 1 | Software |
| GAME_ROTATION_VECTOR | Rotation vector component along the x,y,z axes | 3 | Software |
| GEOMAGNETIC_ROTATION_VECTOR | Rotation vector component along the x,y,z axes | 3 | Software |
| MAGNETIC_FIELD | Geomagnetic field strength along the x,y,z axes | 3 | Hardware |
| MAGNETIC_FIELD_UNCALIBRATED | Geomagnetic field strength (without hard iron calibration) and Iron bias estimations along the x,y,z axes | 6 | Software |
| ORIENTATION | Azimuth, Pitch, and Roll | 3 | Software |
| PROXIMITY | Distance from object | 1 | Hardware |
Some sensors are "uncalibrated" versions of others with the same name. These sensors provide additional raw values along with some bias. These types of sensors can be useful when an application conducts its own sensor fusion. More information on uncalibrated sensors can be found in https://source.android.com/devices/sensors/sensor-types.html.
A smartphone may contain device-specific, non-standard sensors that are not defined in the above table. The information collected by any of the sensors, including the non-standard sensors, are saved as separate protocol buffer messages.
Some devices also implement software-based one-shot composite sensors, such as glance gesture, pick up gesture, significant motion, and wake up gesture. These sensors, also called trigger sensors, are used for end-user convenience, such as to briefly turn the screen on or to mimic press of the power button. Since these convenience features do not provide any clear benefits to localization systems, we did not implement support for them, but they may appear in the collected data if they are triggered.
In our implementations, we detected the set of sensors that were installed in the smartphones by querying the sensor-list by calling the getSensorList() method of the SensorManager class and by using the TYPE_ALL constant as in:
List<Sensor> sensorList = mSensorManager.getSensorList(Sensor.TYPE_ALL);
Some devices provide both wake-up and non-wake-up sensors of the same type. Since a sensor’s wake-up feature is not relevant to our measurements, we used SensorManager's getDefaultSensor() method to register only to one of each sensor type to avoid redundancy.
Android's sensor framework uses a standard 3-axis coordinate system as shown below:
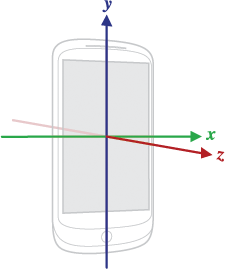
It is important to note that the axes of this coordinate system do not change or swap if the orientation of the device changes. For example, the z-axis remains pointing outward of the screen even when the person collecting data is crawling on the floor instead of walking.
Each sensor component has a different reporting frequency. When the app registers to a sensor at the fastest rate, the reporting frequency can be as fast as 250 Hz. Unfortunately, asking for the fastest possible rate sometimes causes individual sensors to be deprioritized and starved. For example, the Samsung smartphone reported far fewer readings from the pressure sensor when all the sensors were registered at the fastest rate. To avoid loss of important data, we programmatically registered to the sensors at a 100 Hz rate, which is commonly selected in research on human motion recognition using motion sensors like accelerometers. This gave all sensors enough time to report their values. Temperature, light, proximity, and humidity sensors, and the step counter generate values only if their last measured values have changed.
http://developer.android.com/guide/topics/sensors/sensors_overview.html#sensors-intro
https://source.android.com/devices/sensors/sensor-types.html#magnetic_field_sensor
http://developer.android.com/reference/android/hardware/SensorEvent.html
Sensors output:
Each time a SensorEvent is created by the SensorEventListener, it is saved as a protocol buffer message, with the application’s timestamp, the dot-index for the last dot visited, an object of SensorEvent with its own timestamp (nanoseconds), the relevant sensor’s ID, accuracy, and the values array as a repeated field. The name of this data file is {prefix}_Sensors.pbs.
3. GPS
Detected geophysical position using GPS are recorded in files whose names end with "GPS.pbs".
During the data collection campaign, whenever the smartphone got a location fix, the GPS information along with the accuracy of that fix was saved as a separate protocol buffer message. We used "fine location" information, which is derived directly from the GPS signals. Since the measurements were performed indoors most of the time, it was not possible to receive the GPS signal. If the device could not derive a location from the GPS signals, then no data was written into the output file.
The GPS data is provided by the LocationManager class, by using the ACCESS_FINE_LOCATION permission and the GPS_PROVIDER constant while registering to it.
GPS output:
The provider of the location information is LocationManager class, which calls the onLocationChanged method of the LocationListener class, whenever it finds a new location. By calling that method, an object of Location class is created and the information that this object carries is written into the file system. The name of this data file is {prefix}_GPS.pbs.
4. Wi-Fi
RF signal strengths measured from Wi-Fi access points (APs) in range and other information provided by the APs operating in the 2.4 and 5 GHz channels are recorded in files whose names end with "WiFi.pbs".
The Wi-Fi scans were performed back-to-back by using the startScan() method of the WifiManager class. The frequency of these scans depend on the Wi-Fi chip’s firmware and the Wi-Fi driver implementation on a given smartphone. Since these implementations are provided by the manufacturers, the speed of a Wi-Fi scan changes from device to device, which were roughly between 0.9 and 3.5 seconds. Android's Wi-Fi connectivity API supports passive scanning only.
Upon completion of a Wi-Fi scan cycle, the WifiManager sends SCAN_RESULTS_AVAILABLE_ACTION to the BroadcastReceiver and the scan results are obtained via the getScanResults() method, which returns a List of ScanResult objects. Each ScanResult object contains information for one particular access point. This list of results was then saved as a single protocol buffer message in repeated fields for each AP.

Wi-Fi output:
Wi-Fi scans are triggered by the startScan() method of the WifiManager class. The results are received by a BroadReceiver as a ScanResult object, which contains the values relevant to one access point only. A Wi-Fi protocol buffer message contains data from many repeated instances of the ScanResult object. The name of this data file is {prefix}_WiFi.pbs.
5. Cellular
Identity information and RF signal strengths measured from cellular network signals are recorded in files whose names end with "Cellular.pbs".
The Android operating system continuously scans for cellular signals and a scan cannot be triggered by a user-level application. Therefore, the system periodically (at 1 Hz rate) calls the getAllCellInfo() method, which returns all observed cell information from all radios on the device including the primary and neighboring cells as a list of CellInfo objects that are then written onto the file system as repeated fields of the relevant protocol buffer messages.
Samsung Galaxy S6 was different from the other three devices, because the CellInfo objects did not contain valid values. As a work-around solution, we utilized the PhoneStateListener class to get cellular signal related values from the registered network. This allowed us to obtain received cellular signal related information, but only for the network that the device was registered to.
Cellular output:
The cellular network was continuously scanned by the operating system, and the latest scan results were written into the file system at a 1 Hz rate. The protocol buffer messages contain the information that CellInfo objects contain that are returned by the getAllCellInfo() method of the TelephonyManager class. The name of this data file is {prefix}_Cellular.pbs.
6. Metadata
The metadata is recorded in files whose names end with "Metadata.pbs".
It contains information about a particular measurement run, device information, list of sensors, and the initial barometer value. The information about the measurement run is composed of the building-identifier and the scenario-identifier. The measurement device’s information contains brand, model, ID and manufacturer name. This device information is obtained from the final Strings of the Build class, such as Build.DEVICE and Build.MODEL. The list of sensors is obtained from the getSensorList(int) method of the SensorManager class. Only the default sensors are used both in Metadata and for the measurements.
If the smartphone has a barometer, the first 5 pressure sensor measurements at the beginning of a data collection scenario are averaged and included in the metadata as the initial barometer value. This value can help an indoor localization app detect elevation changes due to movement from one floor of the building to another. For each measurement run, one protocol buffer message for the metadata in each smartphone was generated.
Metadata output:
This file contains a single protocol buffer message with the information described above. The name of this data file is {prefix}_Metadata.pbs.
7. Building-Specific Information
The coordinates of the corners of the four buildings are made available in the file buildings_corners.csv. Seven numbers are stored in each line of this file. Specifically, building number, corner index, Cartesian coordinates of each corner in meters (three numbers), latitude of the corner, and longitude of the corner are stored. The elevation of the corner is the same as the z coordinate.
The coordinates of the Wi-Fi APs deployed in the four buildings as well as some other neighboring buildings are made available in the file WiFi_APs.csv. Six numbers are stored in each line of this file. Specifically, the BSSID for the AP, Cartesian coordinates of each AP in meters (three numbers), latitude of the AP, and longitude of the AP are stored. The elevation of the AP is the same as the z coordinate. Note that the BSSID is a 12-digit hexadecimal number with five ":"s placed after the second, fourth, sixth, eighth, and tenth digits. For example, it may look like "88:75:56:ef:bc:a0". Information about Wi-Fi APs in some buildings that are neighbors of the four buildings are included, because they are heard in the four buildings. On the other hand, there were no Wi-Fi APs in Building 1. Finally, one may find other Wi-Fi data in the PerfLoc data sets for which we do not have the coordinates for the APs.
The coordinates of the training dots are made available in four files, one for each building. The file for Building 1 is called B1_S00_Training_Dots.csv, and so forth. Six numbers are stored in each line of any of these four files. Specifically, dot index, Cartesian coordinates of each dot in meters (three numbers), latitude of the dot, and longitude of the dot are stored. The dot indices are according to the associated file {prefix}_Dots.pbs for Scenario 00 in that building.
8. Definitions of Protocol Buffers
The protocol buffer definitions are made available through the files dot_data.proto, sensor_data.proto, gps_data.proto, wifi_data.proto, cellular_data.proto, and meta_data.proto.
A Note about Wi-Fi BSSIDs and MAC Addresses
Each Wi-Fi AP deployed in the buildings we used for data collection and neighboring ones has a base radio MAC address and operates in both 2.4 and 5 GHz ISM frequency bands. The base radio MAC address is a 12-digit hexadecimal number with a "0" in the rightmost position. Three networks with SSIDs "CorpNet", "Corp-Visitor", and "" (empty field) are supported in each frequency band. When a smartphone does a Wi-Fi scan, the result is a list of Wi-Fi records. Each Wi-Fi record comprises a BSSID for each Wi-Fi signal received, a SSID among the above three choices, a "capabilities" field, the frequency in MHz of the signal, the Received Signal Strength Indicator (RSSI) in dBm, and a UNIX timestamp. The BSSID for a Wi-Fi signal received from a particular AP is the same as the base radio MAC address for that AP with only the rightmost digit changed. There can be as many as six signals received from a given AP corresponding to various choices for the network (3) and frequency band (2). Therefore, there can be six BSSIDs that are derived from the same base radio MAC address for the AP. Since the base radio MAC addresses are unique, there will not be any confusion in figuring out from which Wi-Fi AP a received Wi-Fi signal is coming from. The base radio MAC addresses and 3D coordinates of the Wi-Fi APs are made available as part of the PerfLoc data.
It should also be noted that the Wi-Fi APs may use Transmit Power Control (TPC). The use of TPC is optional, but it is enabled by default for the obvious benefits it provides. In addition, not all frequencies in the 5 GHz band can use the same power outputs (UNII-1 vs UNII-3, for example). All this makes it more challenging to figure out the path loss for a given Wi-Fi signal as it propagates from the AP to the smartphone, where it is received. If the AP transmit power was fixed and known, the path loss would be the difference between the RSSI and the transmit power, and this would have provided a rough idea of the distance between the AP and the smartphone. This, however, is not the case and the APs change their transmit powers occasionally, as needed. For more information on this topic, the reader is referred to the relevant Cisco Radio Resource Management White Paper.
A Note about Cellular Base Station Locations
The locations of the cellular base stations can be found in public databases (e.g., OpenCellID) using the identity of each base station, which is stored in the {prefix}_Cellular.pbs files along with other base station information such as network type and signal strength. Based on the locations of the nearby base stations and their corresponding signal strengths, the distance from the smartphone to these base stations can be estimated using an appropriate RF signal propagation model. However, given that a GPS fix for the starting location of each T&E scenario is provided as part of the PerfLoc data, we do not expect the cellular data to have much of a contribution to the localization accuracy of the apps that will be developed based on the PerfLoc data.
User Instructions for Uploading Location Estimates
Once a user has downloaded the PerfLoc data and developed an Android indoor localization and tracking app, the user is in a position to upload the location estimates generated by his/her app to have the performance of the app evaluated in real-time over the web. In order to do this, the user has to upload a single file of a specific type and format:
- The file must be a comma-separated values (CSV) file having a .csv extension.
- The file must contain three real numbers on each line separated by two commas (","s) and no spaces before/after the commas. Each number must have a decimal point. The three numbers are the 3D Cartesian coordinates of the dot on the floor at a specified time during data collection in a given building over a given T&E Scenario. Note that the phones were attached to the arms of the test subject at an average height of 130 cm above the floor level when he was standing and at an average height of 15 cm above the floor level when he was crawling on the floor. The distance from one arm to the other was 45 cm when the arms were hanging on the sides of the test subject. The arrangement of the four phones on the arms of the test subject is specified in the Introduction. Note that the phones are facing different directions and the 3D Cartesian coordinate system of each phone is different from the 3D Cartesian coordinate system of the building in which the coordinates of the dot need to be estimated. Also, note that the phones' orientations changed with the motions of the arms of the test subject as he moved around in the building. Finally, the height above the floor level of the bed of the push cart, where we placed the phones in certain scenarios, was 75 cm.
- The file cannot contain any letters or other characters.
- The file must have 16,264 lines. Hence, it must contain 16,264 * 3 = 48,792 numbers.
- The data must be organized according to the table shown below. Note that only entries for the rightmost three columns in the table, under column headings x, y, and z, need to be uploaded. Only one row for each T&E Scenario has been shown. The correct number of rows has been specified in parentheses.
| Phone | Building | Scenario | x | y | z |
|---|---|---|---|---|---|
| OnePlus 2 (4066 rows) | Bldg. 1 (1490 rows) | S01 (244 rows) | |||
| S02 (126 rows) | |||||
| S03 (123 rows) | |||||
| S09 (132 rows) | |||||
| S10 (286 rows) | |||||
| S11 (146 rows) | |||||
| S12 (136 rows) | |||||
| S13 (144 rows) | |||||
| S14 (153 rows) | |||||
| Bldg. 2 (1128 rows) | S01 (316 rows) | ||||
| S02 (148 rows) | |||||
| S03 (41 rows) | |||||
| S10 (147 rows) | |||||
| S12 (126 rows) | |||||
| S13 (117 rows) | |||||
| S14 (145 rows) | |||||
| S16 (88 rows) | |||||
| Bldg. 3 (1069 rows) | S01 (220 rows) | ||||
| S02 (147 rows) | |||||
| S03 (128 rows) | |||||
| S10 (126 rows) | |||||
| S12 (153 rows) | |||||
| S13 (144 rows) | |||||
| S14 (151 rows) | |||||
| Bldg. 4 (379 rows) | S01 (84 rows) | ||||
| S02 (53 rows) | |||||
| S03 (50 rows) | |||||
| S10 (90 rows) | |||||
| S12 (52 rows) | |||||
| S13 (50 rows) | |||||
| LG G4 (4066 rows) | Bldg. 1 | ||||
| Bldg. 2 | |||||
| Bldg. 3 | |||||
| Bldg. 4 | |||||
| Motorola Nexus 6 (4066 rows) | Bldg. 1 | ||||
| Bldg. 2 | |||||
| Bldg. 3 | |||||
| Bldg. 4 | |||||
| Samsung Galaxy S6 (4066 rows) | Bldg. 1 | ||||
| Bldg. 2 | |||||
| Bldg. 3 | |||||
| Bldg. 4 |
Note that even though a user must upload two location estimates for each dot visited in the T&E Scenario where the test subject pauses for three seconds at the dot, only the location estimate after the 3-second pause will be used for performance evaluation purposes.
Any questions? Please email PerfLoc [at] nist.gov (Subject: Question) (PerfLoc[at]nist[dot]gov).