Official websites use .gov
A .gov website belongs to an official government organization in the United States.

Secure .gov websites use HTTPS
A lock (
) or https:// means you’ve safely connected to the .gov website. Share sensitive information only on official, secure websites.


Trends in Growth
Annual Report on the U.S. Manufacturing Economy

Back to Manufacturing Competitiveness Dashboard
Advancing Competitiveness
Strategies for Advancing Competitiveness
Lead Researcher: Douglas S. Thomas
Trends in the Growth of U.S. Manufacturing and How it Compares to Other Countries
As seen in Figure 2.1, U.S. compound real (i.e., controlling for inflation) annual growth between 1999 and 2024 was 1.5 % for the U.S., which places it below the 50th percentile. This growth exceeded that of France, Japan, and Australia; however, it is slower than that for the world (3.6%) and many emerging economies. It is important to note that emerging economies can employ idle or underutilized resources and adopt technologies that are already proven in other nations to achieve high growth rates. Developed countries are already utilizing resources and are employing advanced technologies; thus, comparing U.S. growth to the high growth rates in China or India has limited meaning concerning the ability of the U.S. to increase manufacturing. As seen in Figure 2.2, the compound annual growth for the U.S. between 2019 and 2024 was 0.2 %. This puts the U.S. just below the 50th percentile above France and Germany among others but still below the world growth of 0.5 %.
Figure 2.12 provides the 5-year compound annual growth (CAG5) rate for each U.S. manufacturing subsector (see label for each industry). The range in growth is from as low as -4.5% in printing and related support activities to as high as 8.2% in motor vehicles, bodies, trailers, and parts manufacturing. Other high-tech industries, such as Computers and electronic product, chemical product, and machinery manufacturing had growth rates of 1.3%, 5.0%, and 0.3% growth. The growth in U.S. manufacturing industries include the following ordered from the highest growth to the lowest:
- Motor vehicles, bodies and trailers, and parts (CAG5: 8.2%)
- Petroleum and coal products (CAG5: 7.1%)
- Other transportation equipment (CAG5: 6.4%)
- Primary metals (CAG5: 5.7%)
- Chemical products (CAG5: 5.0%)
- Apparel and leather and allied products (CAG5: 3.5%)
- Miscellaneous manufacturing (CAG5: 2.0%)
- Food and beverage and tobacco products (CAG5: 1.5%)
- Computer and electronic products (CAG5: 1.3%)
- Wood products (CAG5: 1.1%)
- Machinery (CAG5: 0.3%)
- Electrical equipment, appliances, and components (CAG5: -0.2%)
- Textile mills and textile product mills (CAG5: -1.9%)
- Plastics and rubber products (CAG5: -2.3%)
- Fabricated metal products (CAG5: -2.5%)
- Furniture and related products (CAG5: -3.3%)
- Nonmetallic mineral products (CAG5: -3.8%)
- Paper products (CAG5: -4.0%)
- Printing and related support activities (CAG5: -4.5%)
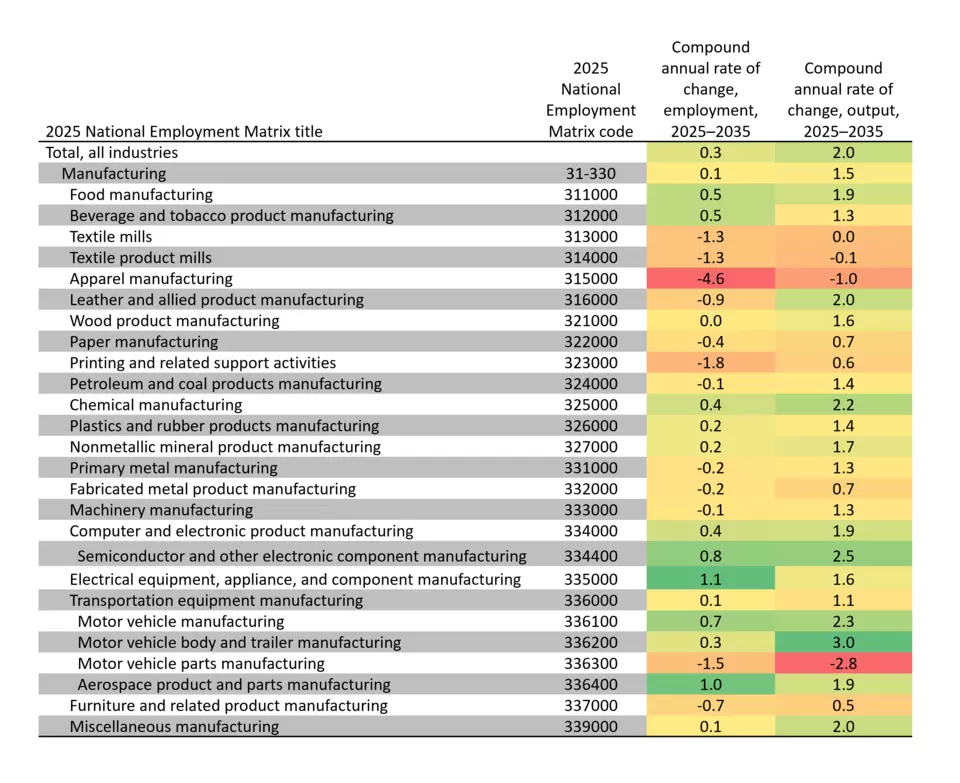
As seen in Table 6.1, at the three digit NAICS level 35 % of manufacturing industries (9 out of 26 industries) have forecasted employment growth greater than or equal to that of total employment for all industries and 23 % of industries (6 out of 26) are forecasted to have growth in output greater than or equal to that of the total for all industries with the compound annual growth for total manufacturing projected to be 1.5% or 75 % of that for the total.
Figure 2.1 (NIST AMS 100-86): National 25-Year Compound Annual Growth, by Country (1999 to 2024): Higher is Better
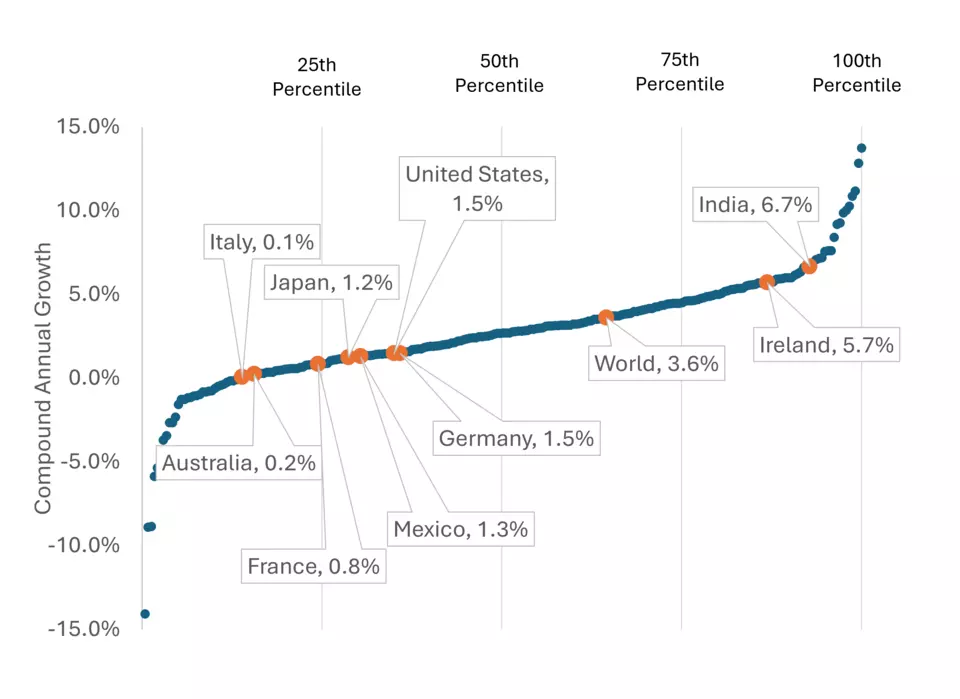
Figure 2.2 (NIST AMS 100-86): National 5-Year Compound Annual Growth, by Country (2019 to 2024): Higher is Better
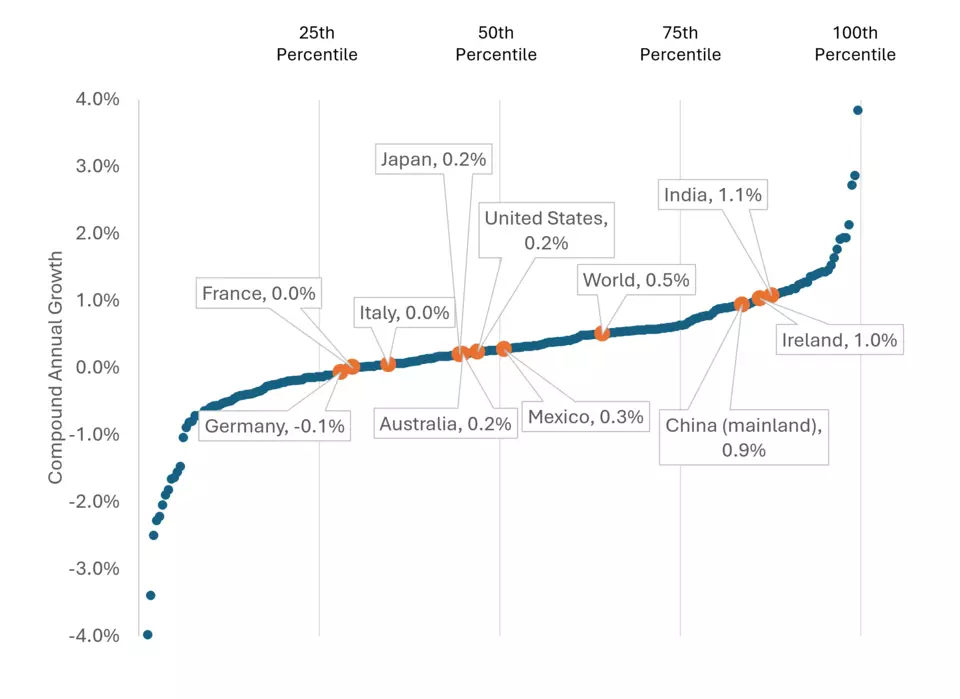
Figure 2.12 (NIST AMS 100-86): Manufacturing Value Added by Subsector (billions of chained dollars), 2005 to 2025
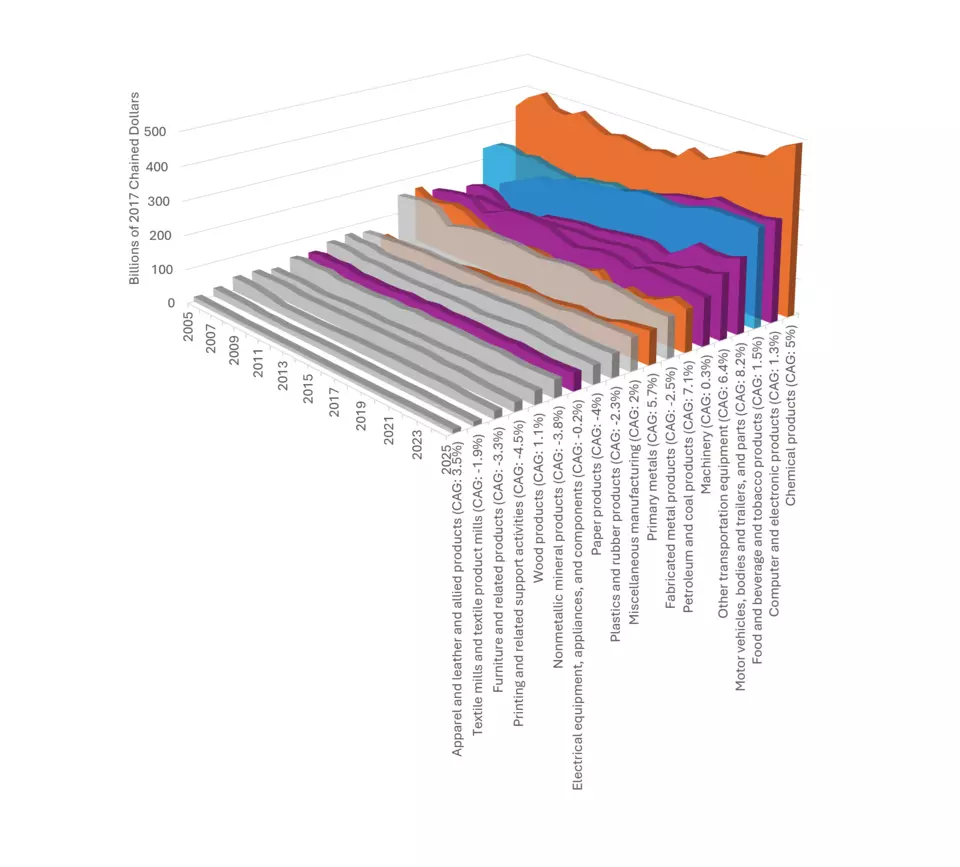
Table 6.1 (NIST AMS 100-86): Forecasted Growth in Employment and Output, Rate and Rank by Industry