Official websites use .gov
A .gov website belongs to an official government organization in the United States.

Secure .gov websites use HTTPS
A lock (
) or https:// means you’ve safely connected to the .gov website. Share sensitive information only on official, secure websites.


Competitiveness Factors
Annual Report on the U.S. Manufacturing Economy
Back to Manufacturing Competitiveness Dashboard
Advancing Competitiveness
Strategies for Advancing Competitiveness
*Factors that Affect Competitiveness*
Lead Researcher: Douglas S. Thomas
Research, Innovation, and Factors for Conducting Business
Measures of Research and Innovation
Manufacturing competitiveness is the result of an ecosystem that includes the cost, quality, and quantity of labor and capital; supply chains; infrastructure; resilience; research and development (R&D); and product differentiation and performance. The characteristics of these factors, and their interactions, can create either opportunities to improve competitiveness or constraints that limit it.
Measuring and comparing innovation between countries is problematic, as there is no standard metric for measuring this activity. Four measures are often discussed regarding innovation: number of patent applications, research and development expenditures, number of researchers, and number of published journal articles. While only R&D expenditures is discussed below, each of the others are discussed in the annual report.
The U.S. ranked 5th in R&D expenditures as a percent of GDP in 2023, which puts it above the 95th percentile (see Figure 5.2) among 84 nations. BEA data on U.S. research and development is broken out in Figure 5.3. Note that in 2023 manufacturing accounted for 29.8 % of U.S. value added research and development and for employment it is 25.4 %. The 5-year compound annual growth in manufacturing R&D employment is 0.5 % and for value added is 3.9 %.
Factors that Facilitate Innovation and Production
a number of indices have been developed to assess national competitiveness. Developing, cultivating, and maintaining a competitive national manufacturing industry requires harmonizing inputs into a well-crafted system. When traffic backs up, electricity grids fail, harbors slow down, or there is a shortage of skilled labor, national manufacturing suffers. This section discusses metrics that examine factors outside of the factories but affect production.
The IMD World Competitiveness Index provides insight into the U.S. innovation landscape. Figure 5.8 provides the U.S. ranking for 20 measures of competitiveness. This provides some indicators to identify opportunities for improvement in U.S. economic activity. In 2026, the U.S. ranked low in prices, public finance, societal framework, and attitudes and values among other things, which might be areas for improving competitiveness. Overall, the U.S. ranked 10th in competitiveness for conducting business while Germany, Japan, and China ranked 23rd, 30th, and 12th, respectively (IMD 2025). Between 2016 and 2026, 75 % or 15 of the 20 rankings went down for the U.S.
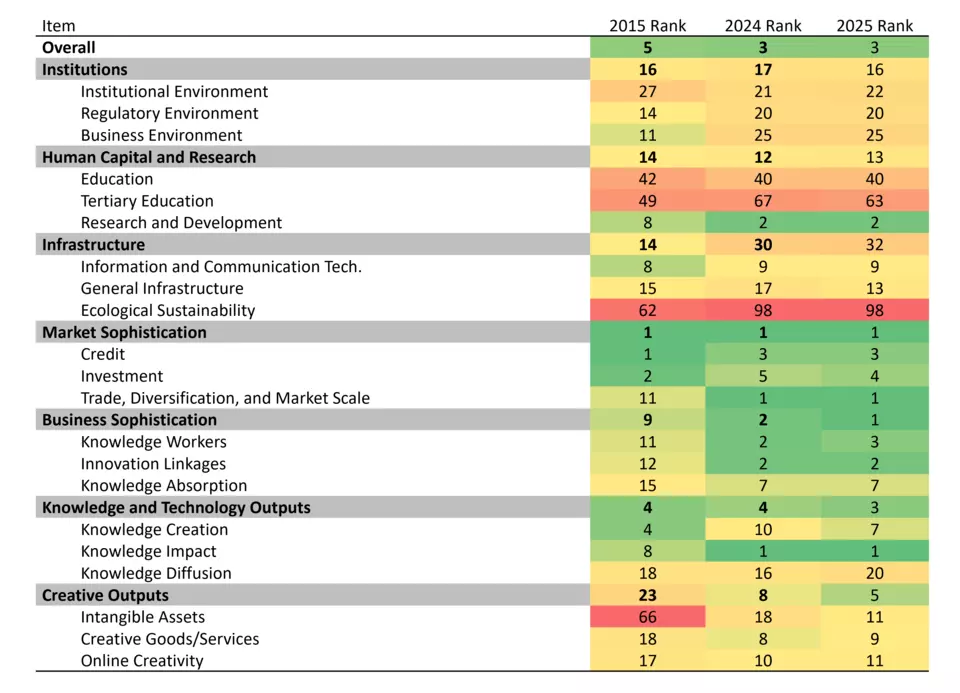
The Global Innovation Index “captures the innovation ecosystem performance of 139 economies and tracks the most recent global innovation trends” (World Intellectual Property Organization 2025). As seen in Table 5.1, this index ranks the U.S. overall as 3rd in innovation with opportunities for improvement in areas of human capital and research, infrastructure, and creative outputs (World Intellectual Property Organization 2025). The U.S. contains 22 of the top 100 science and technology clusters while China has 24 and Germany has 7 (World Intellectual Property Organization 2025). Items shown in orange or red in the table might be seen as areas where there is potential opportunity to improve competitiveness. These might include education, tertiary education, and infrastructure.
Figure 5.2 (NIST AMS 100-86): Research and Development Expenditures as a Percent of GDP, Top Ten Largest Manufacturing Countries
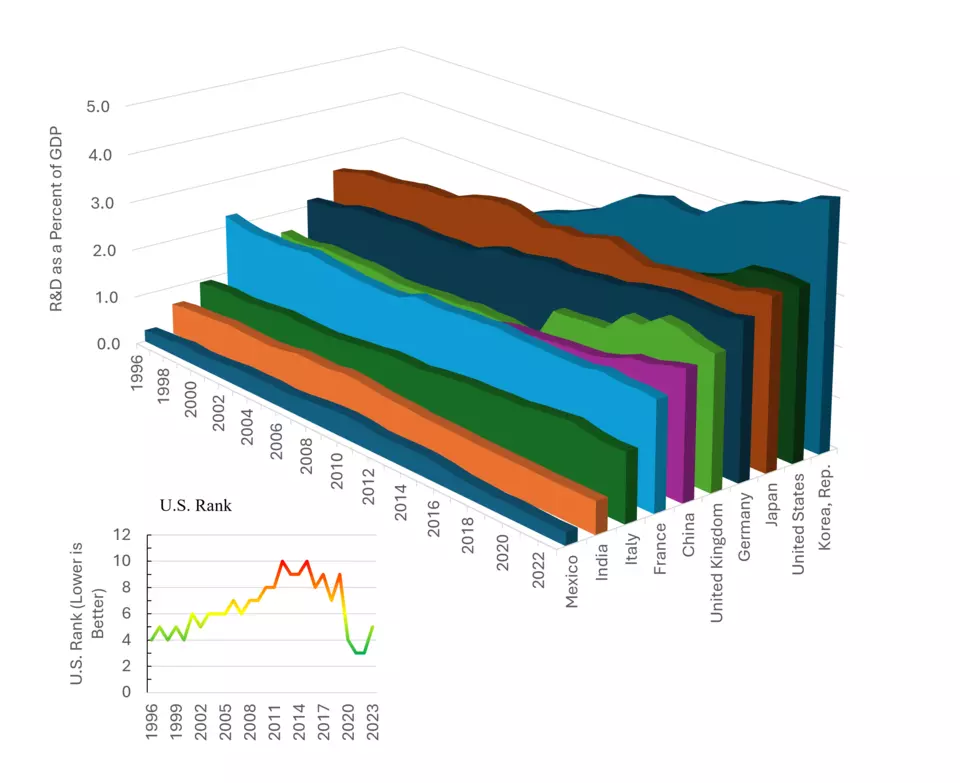
Figure 5.3 (NIST AMS 100-86): U.S. Research and Development Value Added and Employment
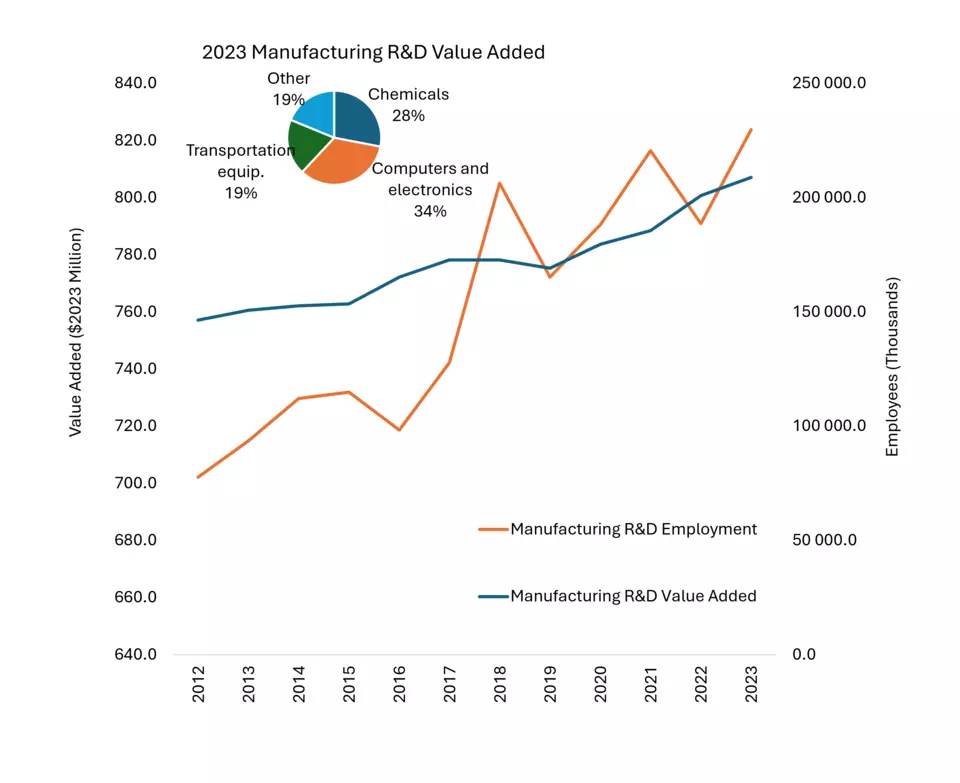
Figure 5.7 (NIST AMS 100-86): IMD World Competitiveness Rankings for the US: Lower is Better (i.e., a Rank of 1 is Better than a Rank of 69) – 69 countries ranked
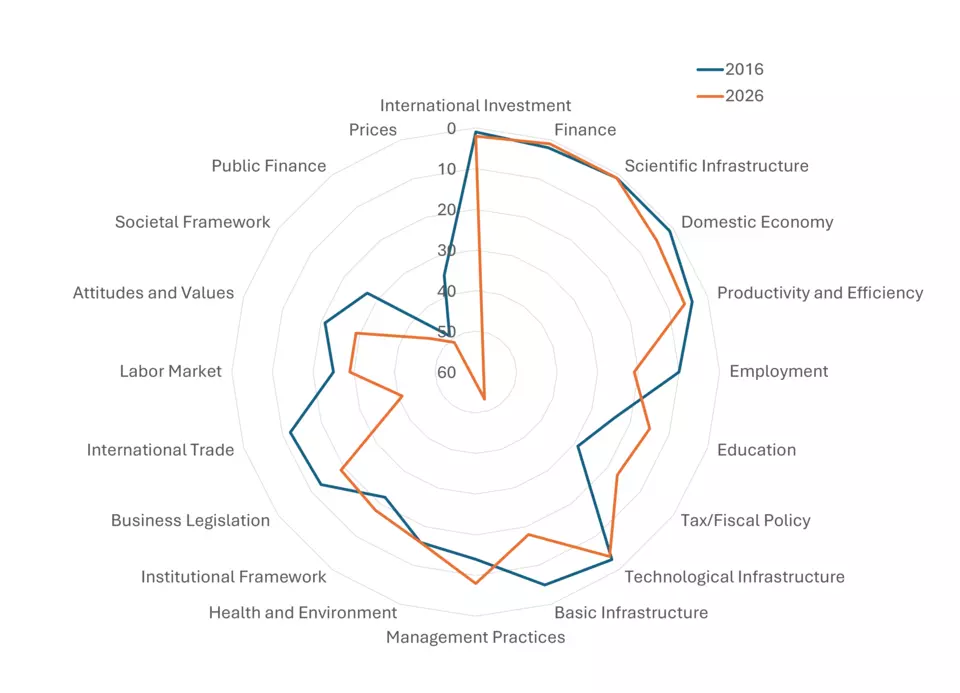
Table 5.1 (NIST AMS 100-86): Global Innovation Index and Components