Official websites use .gov
A .gov website belongs to an official government organization in the United States.

Secure .gov websites use HTTPS
A lock (
) or https:// means you’ve safely connected to the .gov website. Share sensitive information only on official, secure websites.


Supply Chains and Costs
Annual Report on the U.S. Manufacturing Economy

Back to Manufacturing Competitiveness Dashboard
Advancing Competitiveness
Strategies for Advancing Competitiveness
Factors that Affect Competitiveness
*Supply Chains and Costs*
Lead Researcher: Douglas S. Thomas
Supply Chains and Costs
A frequently invoked axiom suggests that roughly 80% of a problem is due to 20% of the cause, a phenomenon referred to as the Pareto principle (Hopp and Spearman 2008). Statistical evidence suggests that a dollar of research and development in a large cost supply chain entity has a higher return on investment than a small cost one (Thomas 2018).
Using data from the Annual Survey of Manufactures (U.S. Census Bureau 2023), Table 3.1 presents the purchases that the manufacturing industry made for production, which is disaggregated into five categories: suppliers of services, computer hardware, software, and other costs (blue); refuse removal (gold); machinery, structures, and compensation (orange); repair of the machinery and structures (red); and suppliers of materials (green). These items all feed into the production of manufactured goods which are inventoried and/or shipped (gray). High-cost items might be seen as opportunities where productivity might have significant effects on competitiveness.
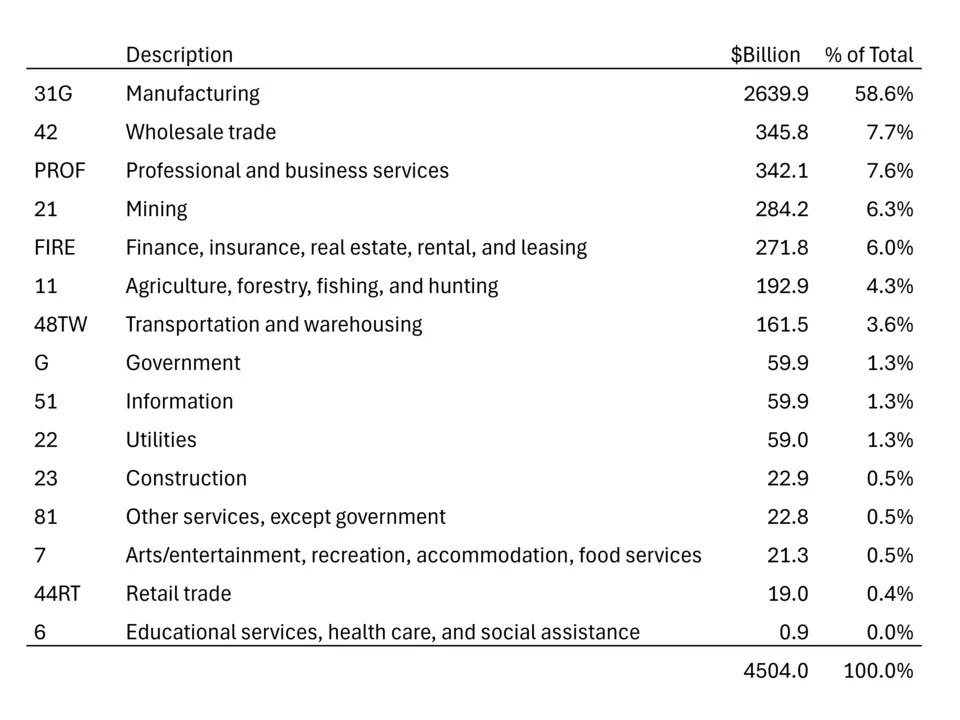
As seen in Table 0.3, the top supply chain good/service cost (measured as indirect output using economic input-output analysis) for discrete manufacturing is primary metals, which accounts for 6.6 % of the total of direct and indirect value added. That is, primary metals contributes 6.6% of the total direct and indirect output for discrete manufacturing. Wholesale trade is the second largest and is the top or second to the top cost for all four manufacturing categories shown (i.e., discrete, discrete tech, process, and food manufacturing). The cost of wholesale trade (e.g., sourcing, distribution, and logistics) is substantial, as is confirmed in the analysis of total manufacturing shown in Table 3.7, which shows the values at a more aggregated level. The magnitude of these costs highlights activities where productivity improvements could have broad effects on manufacturing competitiveness.
For more information on industry supply chains, please see our pages on cost mapping, flow time, and disruption.
Figure 3.1 (NIST AMS 100-86): Manufacturing Supply Chain, 2023
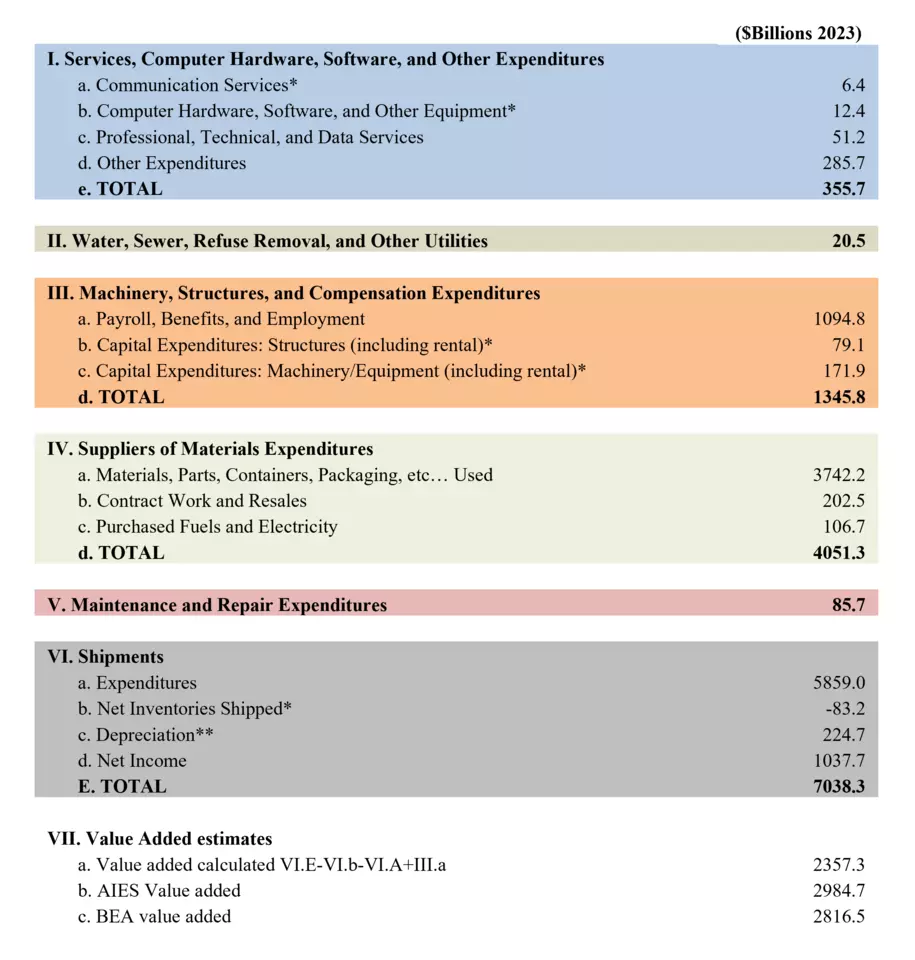
Table 0.3 (NIST AMS 100-86): Supply Chains: Top 5 Intermediate Goods/Services and their Percent of Total Output (Direct and Indirect) by Discrete, Discrete Tech, Process, and Food Manufacturing
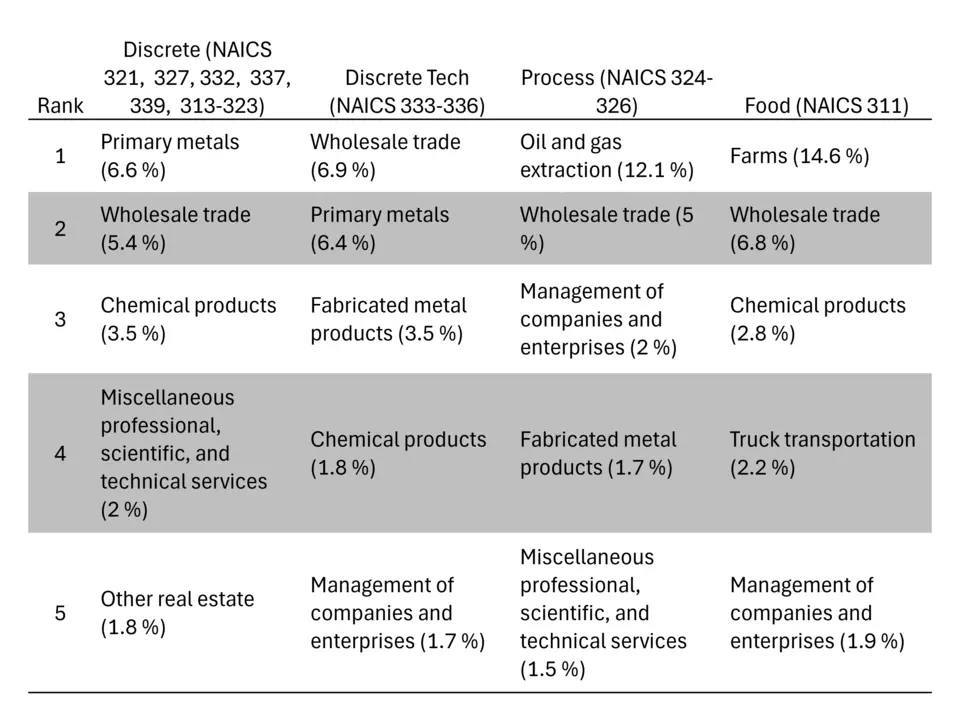
Table 3.7 (NIST AMS 100-86): U.S. Manufacturing Supply Chain (Intermediates), 2024 Value Added