

Official websites use .gov
A .gov website belongs to an official government organization in the United States.

Secure .gov websites use HTTPS
A lock (
) or https:// means you’ve safely connected to the .gov website. Share sensitive information only on official, secure websites.


Competitiveness Dashboard
Annual Report on the U.S. Manufacturing Economy

Advancing Competitiveness
Strategies for Advancing Competitiveness
Lead Researcher: Douglas S. Thomas
SUMMARY: In terms of value added, the primary measure of economic activity, the U.S. is the second largest manufacturing nation in the world behind that of China. The U.S. ranking as a brand suggests that it tends to be a differentiator rather than a cost competitor; however, a number of nations rank higher as a brand. The largest manufacturing subsector in the U.S. is chemical products followed by computer and electronic products, as seen in Figure 2.12 of NIST AMS 100-86. Food, beverage, and tobacco products is third.
There are three primary aspects of examining U.S. manufacturing statistics on competitiveness: (1) how the U.S. industry compares to other countries, (2) the trends in the domestic industry, and (3) the industry trends compared to those in other countries. NIST AMS 100-86 provides statistics on these aspects. Below are highlights from this publication. Due to the necessity to use a selection of datasets, there may be minor discrepancies between various statistics. Additional data and statistics can be estimated using NIST’s Manufacturing Cost Guide.
U.S. Manufacturing Competitiveness Dashboard
Some brief figures on U.S. manufacturing include the following:
- In 2024, Manufacturing contributed $2.4 trillion to U.S. GDP amounting to 10.0 % of total U.S. GDP, measured in chained 2017 dollars, according to BEA data.
- Direct and indirect (i.e., purchases from other industries) manufacturing value added contributed an estimated 15.4 % of U.S. GDP (see Table 3.3 of AMS 100-86).
- According to the Current Population Survey, there were 15.1 million employees in U.S. manufacturing in 2025, representing 9.3 % of total U.S. employment.
Table 0.1 provides a series of rankings for national branding, multi-factor indices, R&D, and output along with the magnitude of high-tech production. Lower ranking numbers equate to better performance and are highlighted in green. The U.S. ranks well in multi-factor indices and R&D metrics; however, it is not ranked at the top for any of them and some are in the double digits; thus, there is room for improvements. Out of the six high tech manufacturing industries shown, the U.S. is the largest for only one.
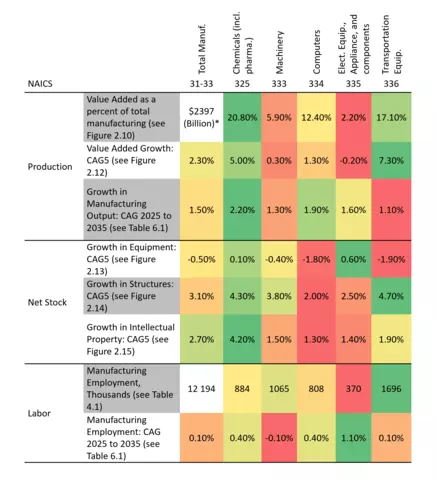
The U.S. is a major manufacturing country, as it is the second largest in terms of value added; however, its 5-year compound annual growth rate is ranked lower (i.e., 129th), which is common for advanced economies as they frequently must advance the productivity frontier in order to grow. Out of the six high-tech manufacturing industries shown, the U.S. is the largest for only one and is significantly smaller than that of China for machinery/equipment and electrical equipment. The domestic details in Table 0.2 further confirm the trend, as machinery and electrical equipment account for lower levels of the manufacturing industry value added, have lower growth, and lower forecasted growth compared to the others shown. Even further, their growth in net stock for equipment, structures, and property are lower than that of the other industries shown.
Table 0.1 (AMS 100-86): International Comparison Quick Reference (Rankings and Percent of Global Value Added)
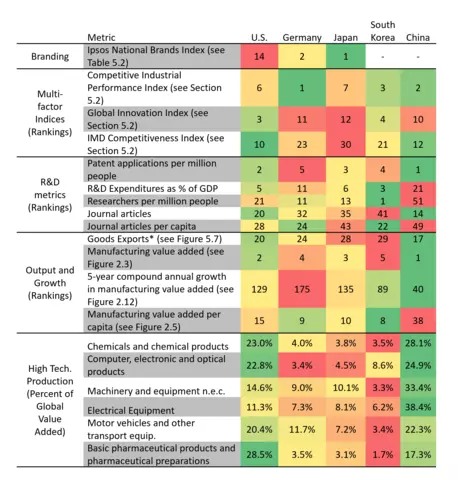
Table 0.2 (AMS 100-86):Domestic Manufacturing Quick Reference (Percent of Domestic Value Added and 5-Year Compound Annual Growth)
Context and Background: Assessing U.S. manufacturing competitiveness is directly relevant to NIST’s mission to promote U.S. innovation and industrial competitiveness through advances in measurement science, standards, and technology. Achieving this mission requires not only advancing individual technologies but also understanding how U.S. manufacturing performs, where competitive gaps exist, and which structural factors influence productivity and industrial capacity. A rigorous, data-driven assessment of manufacturing competitiveness provides a foundation for connecting technological progress to industrial outcomes and for identifying areas where further research, technological development, or investment may have the greatest potential impact. NIST is uniquely positioned to conduct this assessment, as it can combine its expertise in measurement science, industrial technology, and data-driven economic analyses to provide an objective and rigorous evidence base to inform investments in competitiveness.
This report assesses U.S. manufacturing competitiveness through three lenses: the position of U.S. manufacturing relative to other countries, trends in domestic manufacturing, and changes in those trends relative to other countries. Rather than presenting a broad inventory of economic indicators, the report prioritizes diagnostic measures, including manufacturing scale and productivity, that directly inform assessments of competitive position and performance. By combining contextual data with structured international comparisons, the report establishes an evidence base to help NIST and other stakeholders identify competitive gaps, assess risks, and inform strategic priorities. This approach aligns with the economic decision-making framework outlined in NIST AMS 100-80 (Thomas, 2026) and supports more targeted consideration of research, technology development, and investment opportunities.
Contacts
-
(301) 975-4918