Official websites use .gov
A .gov website belongs to an official government organization in the United States.

Secure .gov websites use HTTPS
A lock (
) or https:// means you’ve safely connected to the .gov website. Share sensitive information only on official, secure websites.


Productivity
Annual Report on the U.S. Manufacturing Economy

Back to Manufacturing Competitiveness Dashboard
Advancing Competitiveness
Strategies for Advancing Competitiveness
Lead Researcher: Douglas S. Thomas
Manufacturing Industry Productivity
There is a substantial amount of literature examining productivity with some suggesting that current measures might underrepresent some forms of productivity improvement; thus, some caution is needed when interpreting industry productivity measures. In its simplest form, productivity is the units of output divided by the units of input. A true representation of productivity would likely need to account for not only the inputs and outputs for production of a product but also the use of the product. The evaluation of costs might be similar to how Thomas (2018) evaluates the life-cycle cost of manufactured goods for ground transportation, which includes the time for traveling, fuel, infrastructure costs (e.g., roads), and other costs. The evaluation of outputs would need to measure, in this instance, some unit for distance traveled. Current measures of productivity focus on the production portion of the equation and attempts to account for other costs and benefits through prices; however, prices are unlikely to fully represent the costs and benefits to the user.
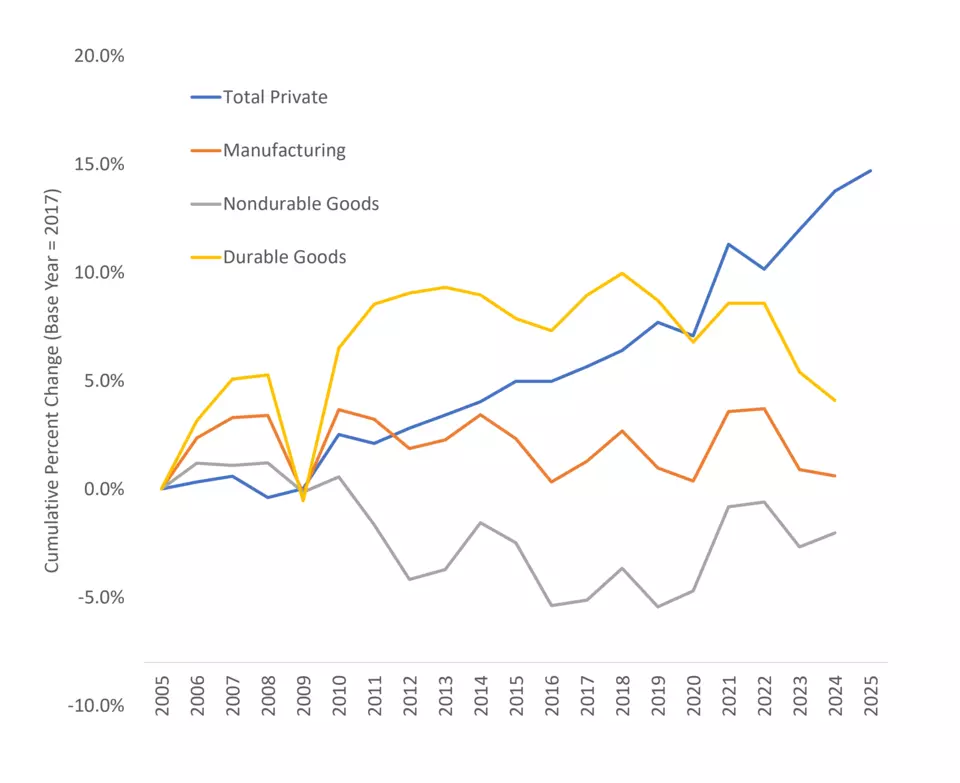
The Bureau of Labor Statistics provides an index of labor productivity and total factor productivity. Labor productivity for manufacturing decreased between 2023 and 2024 by 0.7 %, as illustrated in Figure 4.10. The five-year compound annual growth is -0.4 %. The Bureau of Labor Statistics total factor productivity metric measures “the efficiency at which combined inputs are used to produce output of goods and services” (Bureau of Labor Statistics 2023). For U.S. manufacturing, total factor productivity decreased 0.3 % from 2023 to 2024 and has a 5-year compound annual growth rate of less than 0.1 %, as illustrated in Figure 4.11.
Figure 4.10 (NIST AMS 100-86): Manufacturing Labor Productivity Index (2017 Base Year = 100)
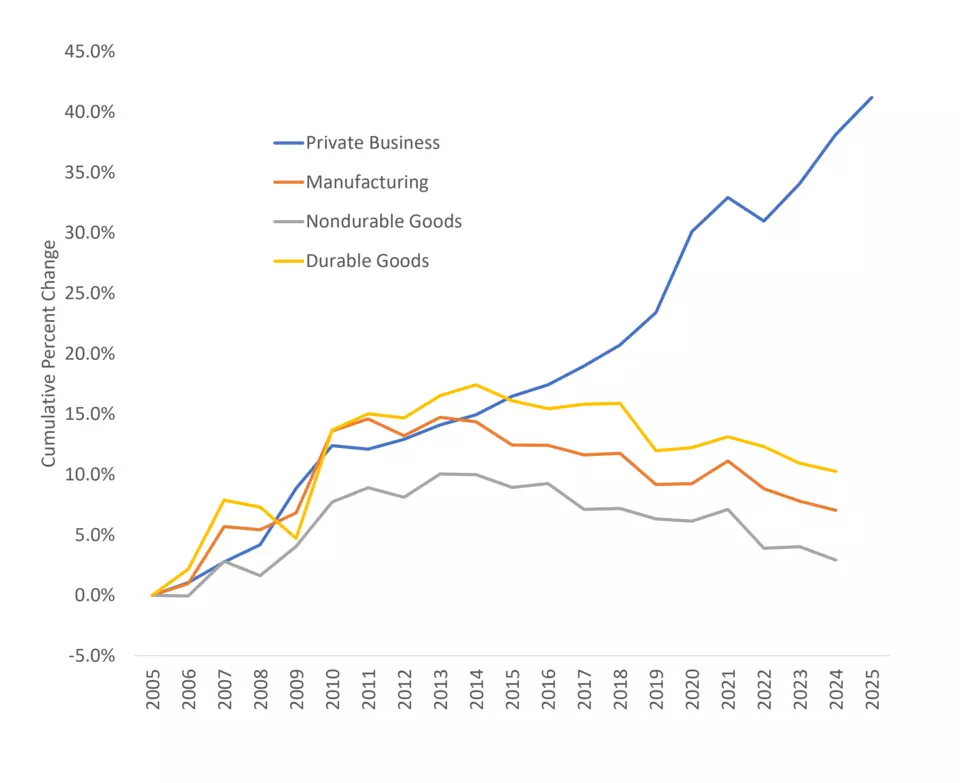
Figure 4.11 (NIST AMS 100-86): Manufacturing Total Factor Productivity Index