

Official websites use .gov
A .gov website belongs to an official government organization in the United States.

Secure .gov websites use HTTPS
A lock (
) or https:// means you’ve safely connected to the .gov website. Share sensitive information only on official, secure websites.


U.S. Production
Annual Report on the U.S. Manufacturing Economy

Back to Manufacturing Competitiveness Dashboard
Advancing Competitiveness
Strategies for Advancing Competitiveness
Lead Researcher: Douglas S. Thomas
What does the U.S. Produce and How does that Compare to Other Countries?
Manufacturing value added in the U.S. in 2024 was $2.4 trillion in chained 2017 dollars or 10.0 % of GDP (Bureau of Economic Analysis 2026a). The U.S. manufactures the following in order of largest in value added to smallest (see Figure 2.10 and Figure 2.11):
- Chemical products ($498.1 Billion)
- Computer and electronic products ($297.3 Billion)
- Food and beverage and tobacco ($292 Billion)
- Motor vehicles/bodies/trailers/parts ($220.5 Billion)
- Other transportation equipment ($190.1 Billion)
- Machinery ($141.1 Billion)
- Petroleum and coal products ($124.8 Billion)
- Fabricated metal products ($119.1 Billion)
- Primary metals ($98.5 Billion)
- Miscellaneous manufacturing ($97.1 Billion)
- Plastics and rubber products ($68.5 Billion)
- Paper products ($55.2 Billion)
- Elect. Equipment/appliances/components ($52.5 Billion)
- Nonmetallic mineral products ($48.8 Billion)
- Wood products ($39.2 Billion)
- Printing and related support activities ($28 Billion)
- Furniture and related products ($23.2 Billion)
- Textile mills and textile product mills ($13.6 Billion)
- Apparel and leather ($11.5 Billion)
As seen in Figure 2.3, among the 10 largest manufacturing nations, U.S. manufacturing value added, as measured in constant 2020 dollars, is the second largest national manufacturing economy (United Nations Statistics Division 2026). In current dollars, the U.S. produced $2.9 trillion in manufacturing valued added while China produced $4.7 trillion in 2024. In terms of subsectors of manufacturing, China produces more than the U.S. in 11 of the 14 subsectors shown in Figure 2.8. When aggregated together, U.S. and European manufacturing value added exceeds that of Eastern and South-eastern Asia (excluding Japan) for 7 of the 14 subsectors. Computer, electronic, and optical products is among those that Asia produces more value added.
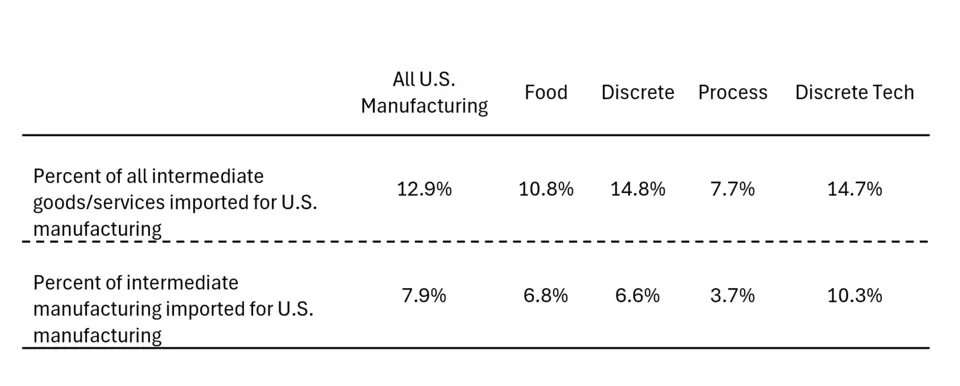
An economic input-output analysis using OECD inter-country input-output data, shown in Table 3.5 shows that U.S. manufacturing products have an estimated 12.9 % of their intermediate goods and services being from foreign origin. When focusing only on the manufactured goods imported, the U.S. manufacturing industry imports 7.9 % of its intermediate manufactured goods. For food, discrete, process, and discrete tech manufacturing, the imported portion of intermediate goods/services is 10.8%, 14.7%, 7.7%, and 14.7% respectively.
Figure 2.10 (NIST AMS 100-86): Value Added for Durable Goods by Type (billions of chained dollars), 2010 to 2025
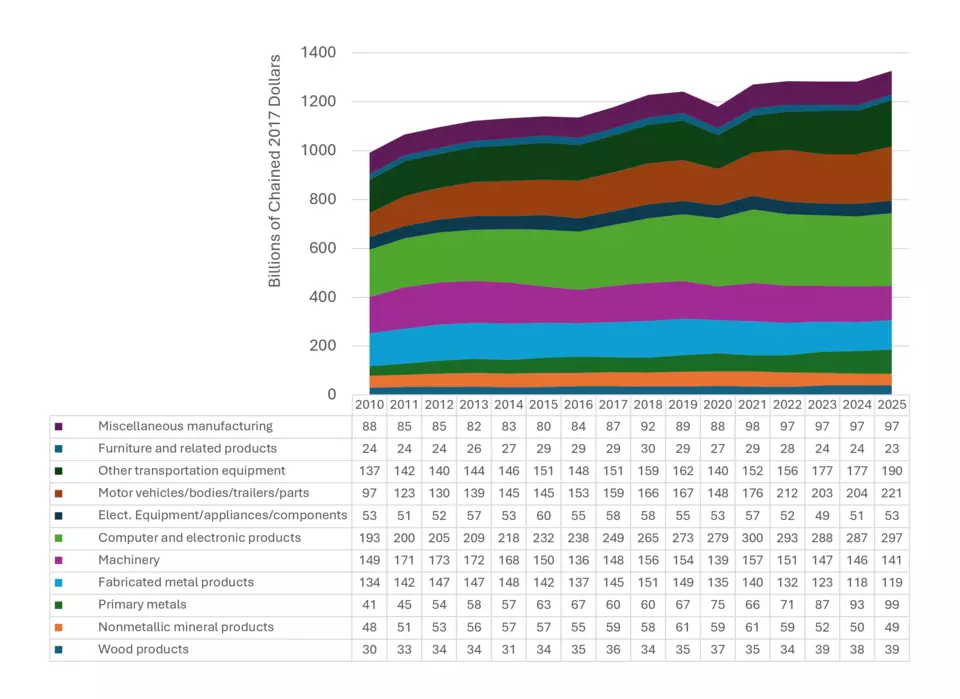
Figure 2.11 (NIST AMS 100-86): Value Added for Nondurable Goods by Type (billions of chained dollars), 2010-2025
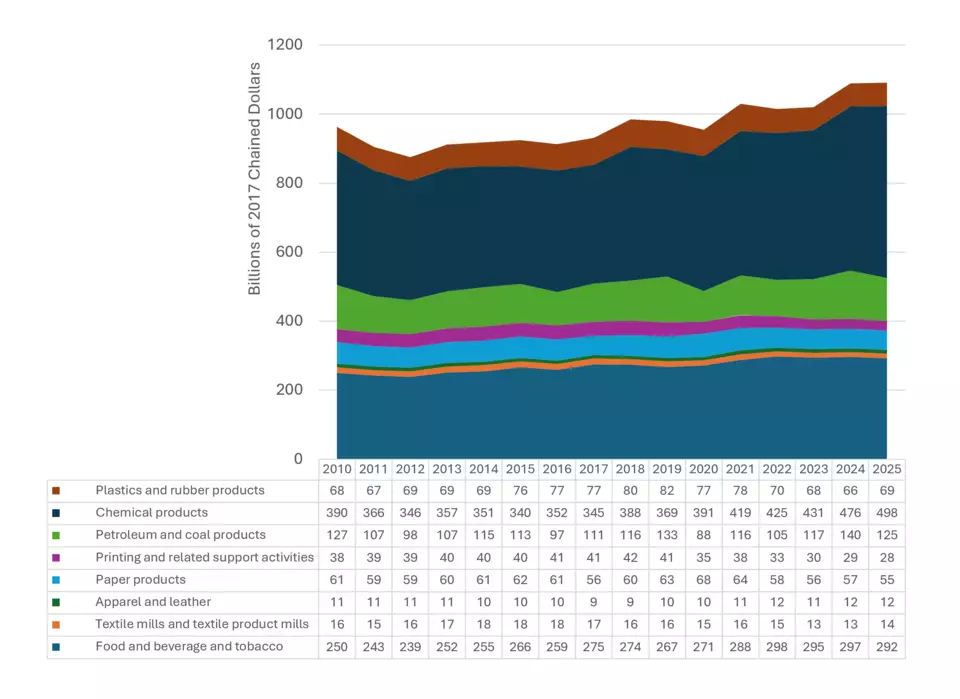
Figure 2.3 (NIST AMS 100-86): Manufacturing Value Added, Top 10 Manufacturing Countries (1970 to 2024)
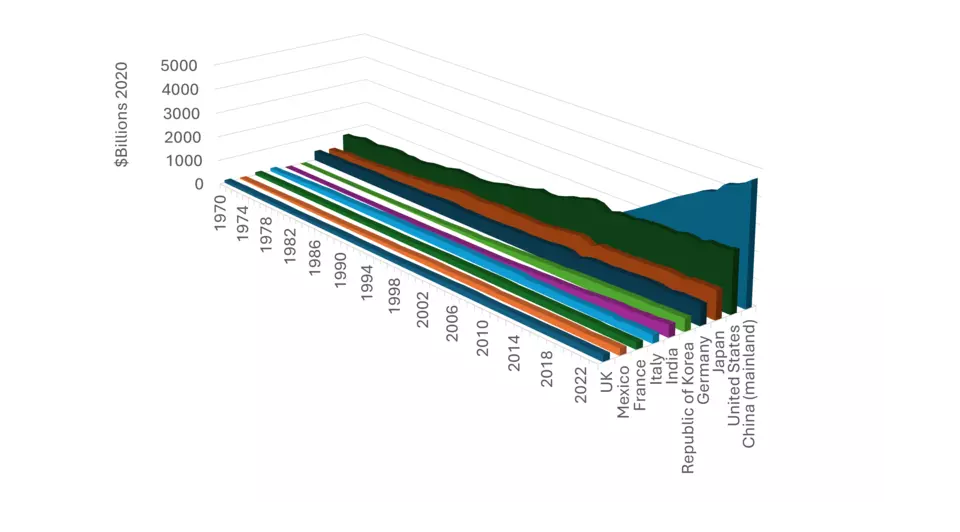
Figure 2.8 (NIST AMS 100-86): Global Manufacturing Value Added by Industry, by Country/Region ($Billion), 2022
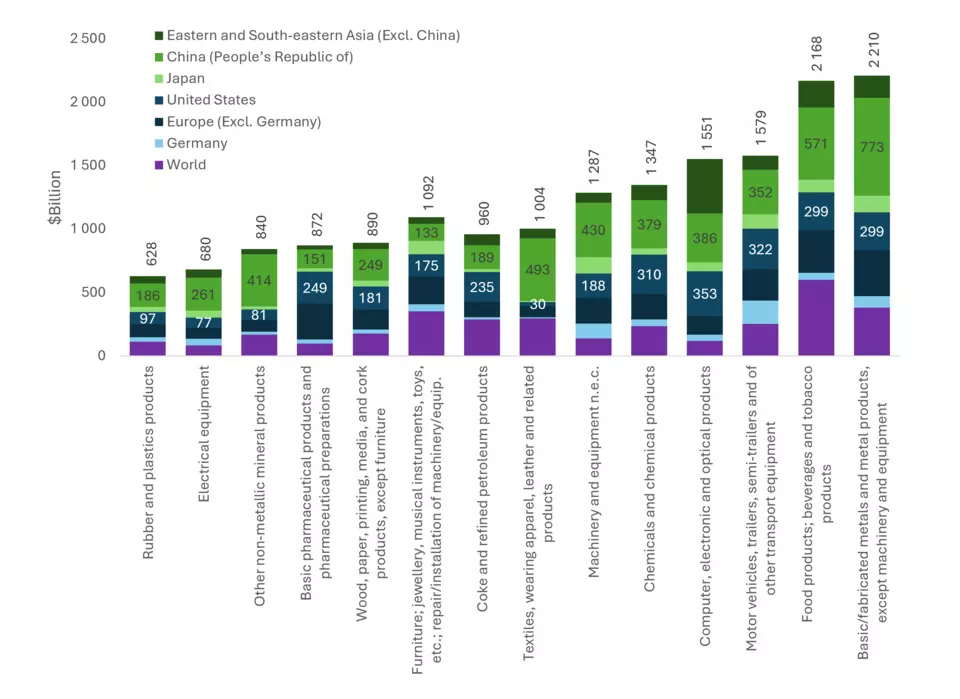
Table 3.5 (NIST AMS 100-86): Percent of Foreign Value Added Embedded in U.S. Manufacturing, 2022
Contacts
-
(301) 975-4918