
Official websites use .gov
A .gov website belongs to an official government organization in the United States.
Secure .gov websites use HTTPS
A lock (
) or https:// means you’ve safely connected to the .gov website. Share sensitive information only on official, secure websites.
Data Analysis
Multi-wavelength measurements with a large area detector produce larger amounts of data (up to 100´ more) compared to the previous instrument configuration. The size of a single data set is in part due to the now simultaneous collection of previously sequential data which requires different post-processing methods.
PF (PeakFit)
The point-and-click approach of the BT-8 analysis software PF is continued. All operations from peak fitting, automatic assignment of phase specific (hkl) for each wavelength and the respective calculation of diffraction elastic constants (DEC) to the calculation of stresses and principal axis transformations require minimal user input. Measurements under applied stresses using both Octo-Strain and the shear device are pre-processed by matching time-stamped DIC strain data to the diffraction data. Unloading cycles can be detected automatically for use as reference d-spacings. Up to three phase can be included in the calculation of the bulk elastic constants, and each can be supplied with its own orientation distribution function (ODF). ODFs are also used for the calculation of DECs.
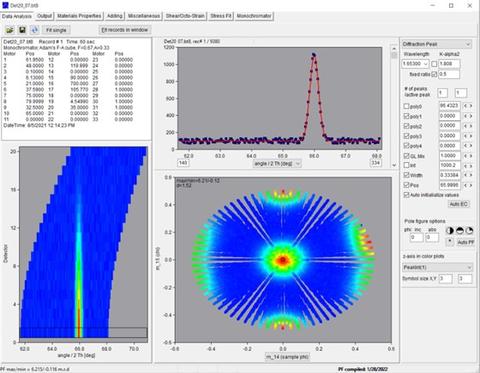
Pole figure or equivalent data can be produced for all available meta-data such as height, width, integrated intensity for each peak, total counts, background, and so on.
PFPlot
Pole figures and ODFs can be visualized using PFplot which also includes options for symmetry operations, filtering and noise reduction, and pole figure rotation.
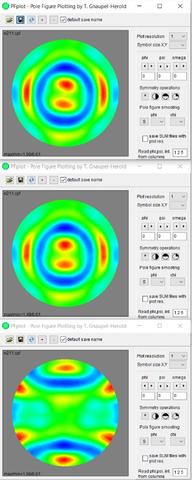
Pole figure operations and visualizations using PFplot. Top: as obtained from EBSD data. Middle: corrected for w-rotation. Bottom: rotation into a new reference frame.
For the large BT8 area detector pole figure rotation corrections may become necessary if pole figures are measured for multiple (hkl) simultaneously. In such a measurement only one peak (hkl) can be measured in the symmetric position (w=q). Pole figures of neighboring peaks will be distorted depending on their angular distance to the symmetric position. Such distortions should be corrected prior to the calculations of the orientation distribution function. The correction can be done automatically in the PF software.
IsoDEC
IsoDEC combines a wide range of elasticity calculations in one package. Diffraction elastic constants (DEC) can be calculated for all major grain-matrix interaction models (Kröner, inverse Kröner, Reuss, Hill, Geometric Average, and more) and using the orientation distribution function (ODF). Bulk elastic constants calculation is performed for up to three phase constituents using any model sensitive to grain-matrix interaction. EBSD data can be used for DEC calculation by finding all grains oriented for diffraction and their respective neighbor grains. The neighbor grains are used to estimate the local matrix constants. This option is available for the Kröner and inverse Kröner model.
IsoDEC can fit single crystal elastic constants to measured DEC for any crystal symmetry. This type of functionality is of interest for a wide variety of materials where single crystal constants are of interest but large single crystals are unavailable. Input data are the slopes of (hkl) specific strains as a (linear) function of applied uniaxial stress.
The executable can be downloaded from Github (https://github.com/IsoDEC/IsoDEC).
Contacts
-
(301) 975-5380