
Official websites use .gov
A .gov website belongs to an official government organization in the United States.
Secure .gov websites use HTTPS
A lock (
) or https:// means you’ve safely connected to the .gov website. Share sensitive information only on official, secure websites.
Understanding PNR Data Features
Reflectometry and Structure
In order to analyze our reflectometry data, we need to have some idea of what features we might expect to see in the data and what they mean. The main features we will focus on here are thickness fringes, the intensity falloff, and the critical edge. All of these features have been highlighted in the example dataset below.
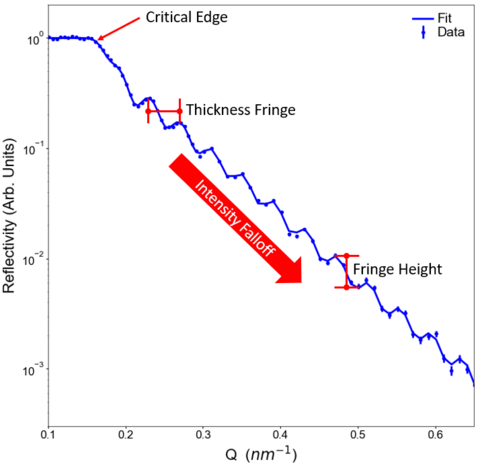
So what information do these features contain?
- The oscillation frequency of the thickness fringes, also be referred to as "Kiessig fringes", contain information about the thickness of the various layers in the thin film structure being probed by polarized neutron reflectometry (PNR). Multiple different oscillation periodicities may be observed in the PNR measurement, associated with the total thickness or the thicknesses of individual layers. Further, the height or magnitude of the oscillations tells us about the relative contrast between the layers of the thin film structure. Specifically, a large nuclear scattering length density difference between two layers will yield a large oscillation while a small difference will yield a smaller oscillation.
- The intensity falloff contains information about the interlayer and/or surface roughness of the thin film structure; the rougher the film, the faster the intensity decreases at higher-Q. As an approximate rule of thumb, one may expect the reflected beam intensity of a perfectly flat sample to be inversely proportional to Q4 past the critical edge, while increased surface roughness progressively reduces the reflected intensity past the critical edge.
- The critical edge, at the angle where total external reflection ceases and the reflectivity starts to drop, is defined by the largest scattering length density contrast in the system. This is generally the difference between the incident media (i.e. vacuum or air) and the largest scattering length density in the system
Note that all of these descriptions are only qualitative approximations intended to give insight into the physics and information content of a PNR measurement. To truly understand the reflectivity curves resulting from a given depth profile, one must explicitly perform the optical matrix transformation for the given structure, as implemented in Refl1D.
Adding Magnetism (without Spin-Flip)
Above, we discussed only the structural information within the reflectivity curve. To understand the magnetic depth profile, we must simultaneously examine the relative intensity of several scattering cross sections. For the case of a sample with an in-plane magnetization aligned exclusively parallel or antiparallel to an applied field (remembering that out-of-plane moments cannot be probed by PNR), we need only examine two of the four cross sections: Up-Up and Down-Down. This notation indicates neutrons which are polarized parallel (or antiparallel) both before and after scattering, so that they are referred to as the non-spin-flip scattering cross sections. In this case we also need to examine the splitting between the two cross sections, as illustrated below.
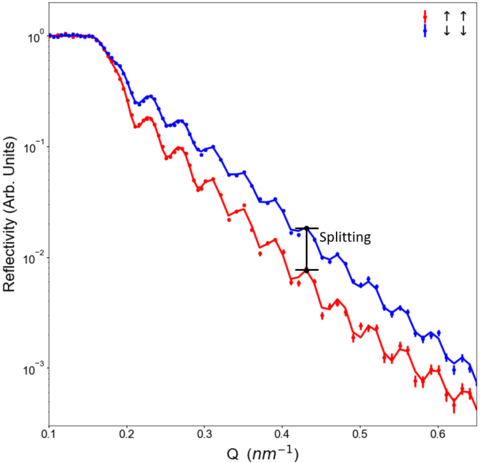
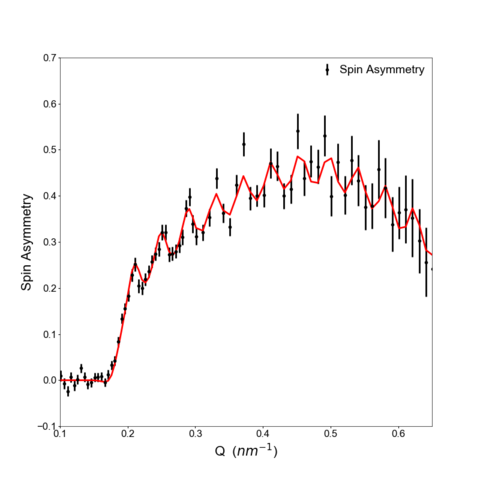
This magnetization-induced splitting between the Up-Up and Down-Down reflectivities contains information regarding the magnetic depth profile of the thin film structure. Although not universally true, it is often the case that a larger splitting between the two cross sections indicates a larger magnetization of the film. Although we will always fit the reflectivity data itself, it is often helpful to plot the spin asymmetry of the reflectivity, defined as (↑↑-↓↓)/(↑↑+↓↓), to better emphasize the magnetic features in the scattering, as shown below:
Spin-Flip Reflectivity
Samples with in-plane magnetization perpendicular to the neutron polarization direction (neutrons will be polarized along the applied field) may give rise to spin-flip reflectivity, in which neutrons are reflected with spin-polarized opposite that of the indicent beam. Thus, we may now have Up-Down and Down-Up scattering cross sections to measure as well. Note that we say "may" give rise here, because perpendicular magnetization components do not always lead to spin-flip reflectivity. To understand this, we must remember that the neutron samples and averages over a region of the sample surface which is defined by the neutron coherence length. If the sample being probed has two perpendicular domains, which we will call "left" and "right", the contributions of the domains will cancel out if the domains are significantly smaller than the neutron coherence length. If the domains are significantly larger, the neutron sees only one domain, no cancellation occurs, and a spin-flip signal is observed. Of course, a sample with a true net perpendicular in-plane magnetization will always give a spin-flip signal.
Magnetization Along the Film Normal
So-called "out-of-plane" magnetization aligned along the film normal is generally not observed in PNR, because the neutron scattering selection rules forbid interactions with magnetic fields along the scattering vector (Q), which is out-of-plane in PNR.