
Official websites use .gov
A .gov website belongs to an official government organization in the United States.
Secure .gov websites use HTTPS
A lock (
) or https:// means you’ve safely connected to the .gov website. Share sensitive information only on official, secure websites.
Semiconductors
Applied Economics in US Manufacturing: Semiconductors
Recently, semiconductor manufacturing has come into the national spotlight. Below are figures on the U.S. semiconductor manufacturing industry from NIST AMS 600-16.
U.S. Semiconductor Manufacturing in Brief
Some brief figures on U.S. semiconductor manufacturing include the following:
- U.S. semiconductor manufacturing value added was $34.4 billion in 2021
- It was 26.1 % larger in 2021 than it was in 2008
- Industry value added has had a 5-year compound annual growth rate (CAGR) of 7.4 %
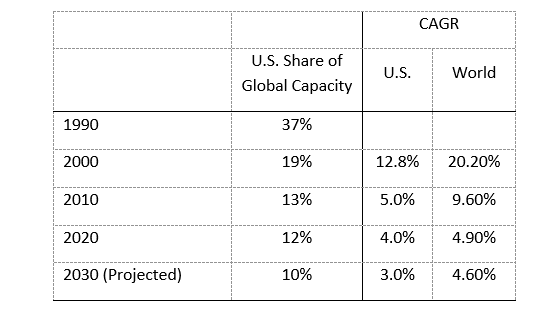
- In 2020, the U.S. had 12 % of the global production capacity down from 37 % in 1990 (See Table A 1)
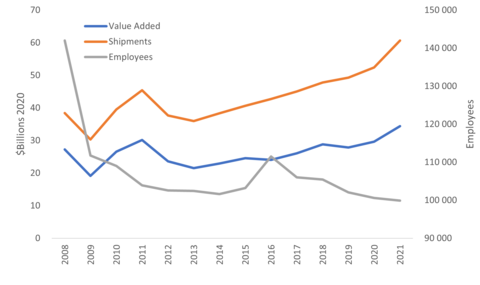
Table A 1 from NIST AMS 600-13: U.S. Share and Compound Annual Growth Rate (CAGR) of Production Capacity
U.S. Semiconductor Manufacturing Sophistication
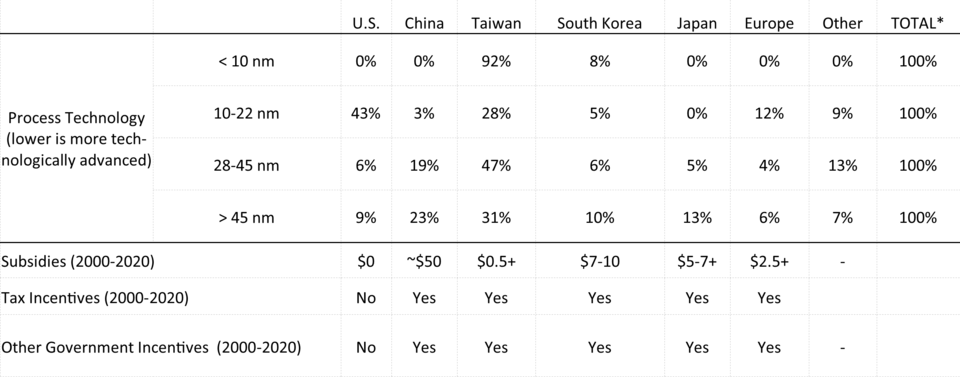
Smaller process technology equates to higher technological sophistication. Below are characteristics of U.S. production.
- In 2019, the U.S. had 43 % of the 10 nm to 22 nm process technology market
- In 2019, the U.S. had little to no capacity for the most advanced technology, which is at the 10 nm or less process technology
Table A 2 from NIST AMS 600-13: 2019 National Share of Global Process Technology and Value of Subsidies, 2019
U.S. Activities occurring Globally in Semiconductor Manufacturing
U.S. companies engage in activities domestically and abroad. Some characteristics are provided below.
- U.S. owned firms, which own facilities around the world, have a commanding position in terms of the design of semiconductors
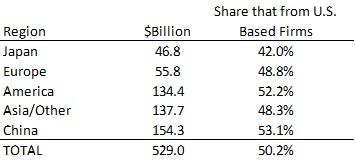
- U.S. firms held significant proportions of national markets, including 53.1 % of the Chinese market
U.S. Firms Share of National Semiconductor Markets
For more information, please see NIST AMS 600-16.
Contacts
-
(301) 975-4918