Official websites use .gov
A .gov website belongs to an official government organization in the United States.
Secure .gov websites use HTTPS
A lock (
) or https:// means you’ve safely connected to the .gov website. Share sensitive information only on official, secure websites.
The Biomanufacturing Economy

Defining the Bioeconomy: There are two general definitions of the bioeconomy. A broader definition is found in the European Union and a narrower one found in the United States. The information presented here is based on NIST report AMS 100-52. It uses the broad definition, which amounts to biomass production and conversion, to identify total biomanufacturing while the narrow definition, which largely includes growing and refining biomaterial, is used to identify advanced biomanufacturing.
Value Added: This report estimates that 2019 U.S. biomanufacturing (i.e., biomass producing and converting industries) value added is $438.8 billion and advanced biomanufacturing (i.e., growing and/or altering biological material with specialized equipment often through non-mechanical means) is estimated to be $94.6 billion calculated using BEA data, consistent with methods to calculate U.S. GDP, as shown in Table 0.1.
Direct and Indirect Value Added: When including indirect value added (e.g., supply chain items), biomanufacturing is $1363.8 billion and advanced biomanufacturing is $259.9 billion.
Environmental Impact: As calculated using NIST’s Manufacturing Cost Guide, based on EPA’s TRACI measures (‘environmental impact’), the production of biomanufactured goods accounts for 43 % of the total environmental impact resulting from economic activity in all U.S. industries, measured as a weighted composite of twelve types of environmental impact, while the production of advanced biomanufactured goods is 6.4 %, as seen in Table 0.1. For the former, food manufacturing (i.e., NAICS 311) accounts for the bulk of the impact, which includes the associated agricultural activities. For the latter, much of the impact is in NAICS 32519 – Other basic organic chemical manufacturing, which includes biofuels.
Table 0.1 from AMS 100-52: Summary of Estimates: Value Added, Environmental Impact, Assets, Flow Time, and Fuels
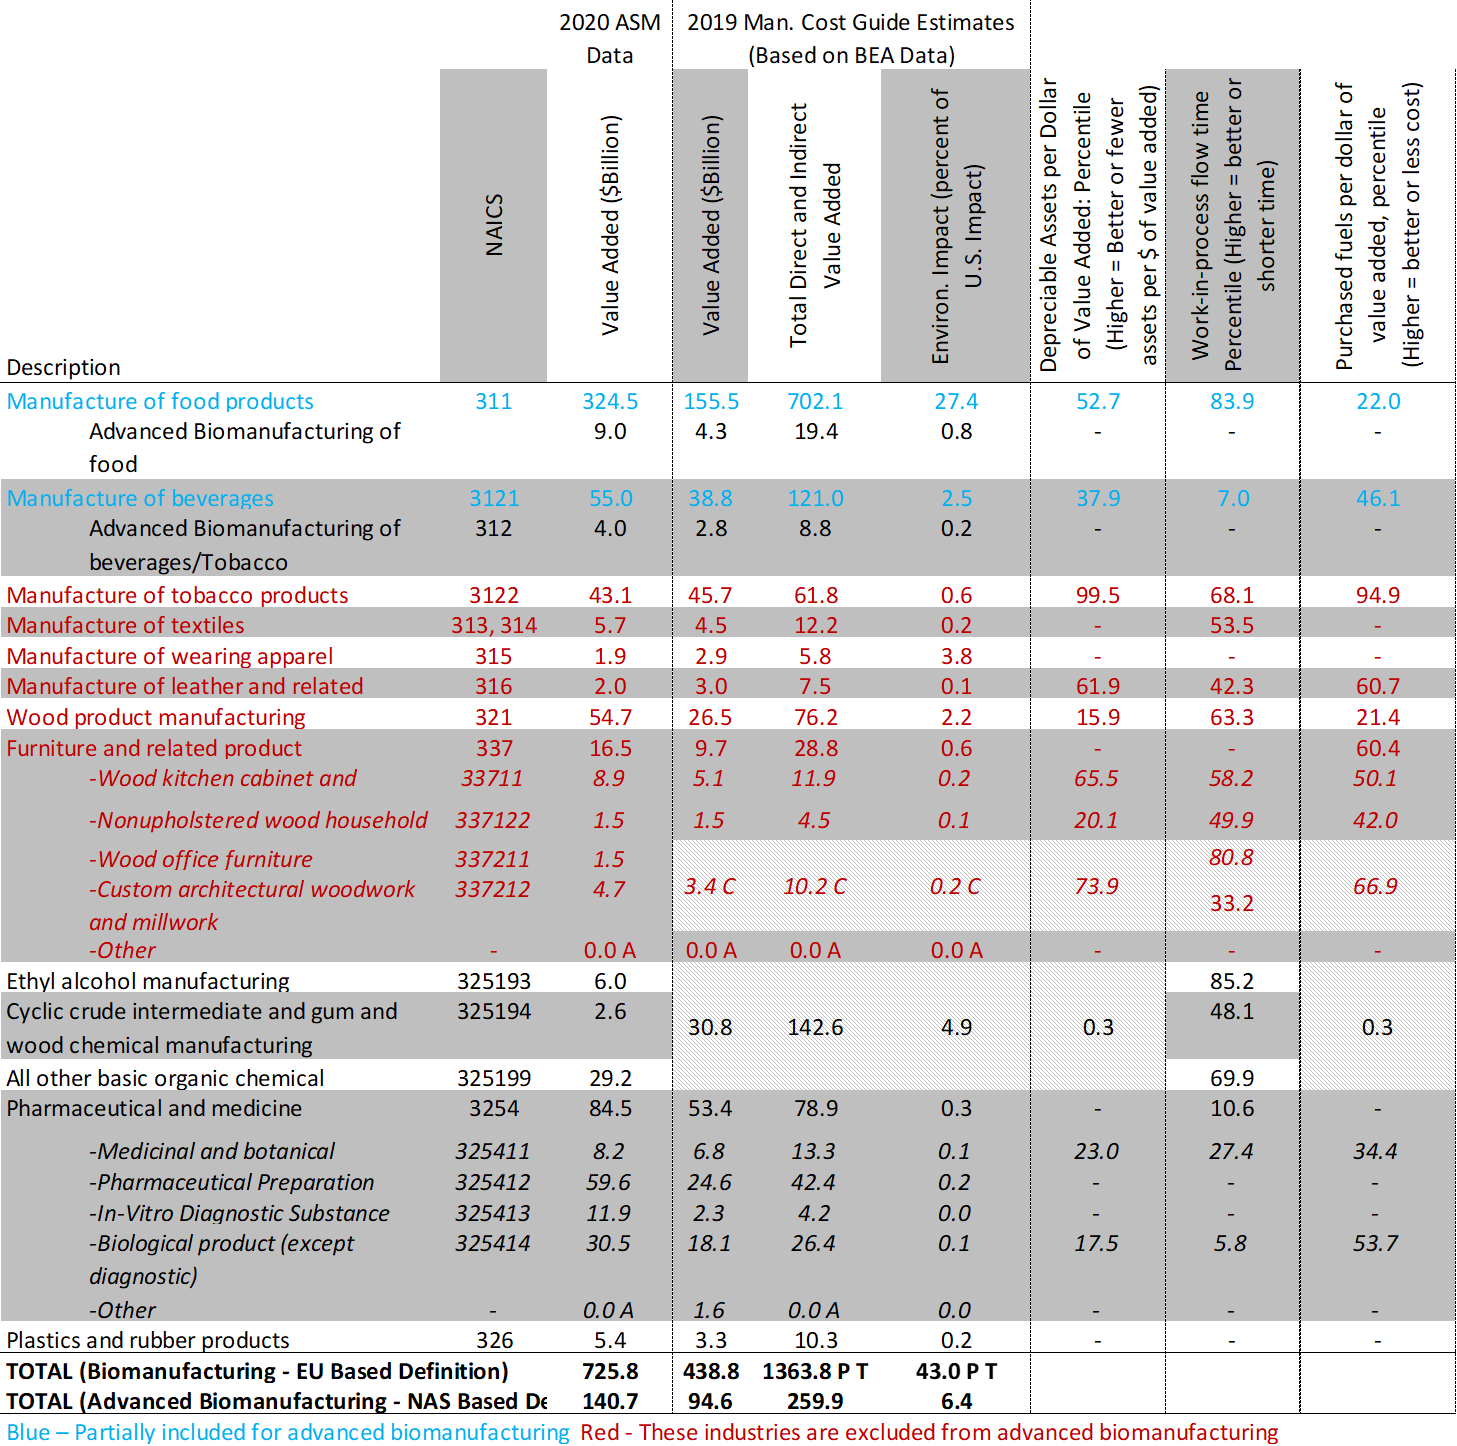
Assets and Flow Time: As seen in Table 0.1, the NAICS codes for advanced biomanufacturing have a high level of depreciable assets per dollar of value added, ranging between less than the 1st percentile to the 23rd percentile among all manufacturing, where lower percentile means more assets per dollar of value added. The percentile is a comparison of all manufacturing NAICS codes. Either a large volume of assets and/or very costly assets are required for advanced biomanufacturing. Additionally, the work in process time for pharmaceutical and medicine manufacturing is high with percentiles as low as 5.8 % where lower means longer flow times and more capital is consumed per unit of production.
Fuels and Electricity: As seen in Table 0.1, a number of advanced biomanufacturing industries have a relatively high level of energy consumption, compared to others in the sector, including ethyl alcohol manufacturing, cyclic crude intermediate and gum and wood chemical manufacturing, and other basic organic chemical manufacturing. These industries might benefit from energy saving efforts.
High Impact Opportunities: This report identifies two types of technological advancements for the bioeconomy that could yield three different types of impact. There are (1) advancements that improve existing processes and (2) those that significantly alter or create new processes. These advancements can result in the (1) reduction of costs/losses, (2) improvement in product quality/performance, and/or (3) reduction of negative externalities. Achieving the different types of advancements can involve different approaches to identifying high impact research. Areas of potential high impact research can be identified using investment analysis combined with best practices in forecasting and prediction, including the following practices:
- Ensure that the question is refined and logical
- Avoid overweighting extraneous information
- Be aware of one’s knowledge boundary
- Break the problem into manageable sub-problems and utilize known data
- Be aware of expert’s knowledge boundary
- Generate testable predictions and forecasts
- Utilize the insight of teams, surveys, or other groups of people
Efficiency Improvement for Current Processes: Utilizing data from the Department of Energy’s Industrial Assessment Centers (IAC), an investment analysis of the recommendations made by IACs reveals areas where there might be high economic returns from efficiency investments often focused on energy efficiency. For example, for the highest 5 % economic returns (measured in net present value) of recommendations to establishments in NAICS 325190 – Other basic organic chemical manufacturing include those regarding thermal systems (e.g., heat recovery) and electrical power management (e.g., avoid peaks). For NAICS 325400 Pharmaceutical and medicine manufacturing, thermal systems (e.g., heat recovery); motors; building heating, ventilation, and air conditioning; contaminants; and waste disposal were among those in the top 5 % of net present value from investments.
Data Needs: A number of data gaps exist in regard to understanding the costs and losses associated with biomanufacturing. These gaps include data on lost batches, supply chains, data/communication errors, feedstocks, goods inventory, machinery maintenance, reprocessing, changeovers, environmental impacts, redundancy, cyber security, developing new products, and in identifying biomanufactured goods. These data gaps might be filled with better ways to identify bio-based goods, including industry specific surveys. There might be literature on some of the data gaps listed; however, an encompassing survey of the literature related to all biomanufactured products along with the different types of missing data is beyond the scope of this report.
For more information, please see NIST AMS 100-52