

Official websites use .gov
A .gov website belongs to an official government organization in the United States.

Secure .gov websites use HTTPS
A lock (
) or https:// means you’ve safely connected to the .gov website. Share sensitive information only on official, secure websites.


Supporting Logic and Evidence
Go To: Advancing Competitiveness Homepage

Lead Researcher: Douglas S. Thomas
A Conceptual Framework for Economic Decision Making in Advancing Manufacturing Industry Competitiveness: Supporting Logic and Evidence
For more information, see NIST AMS 100-80.
The foundation of this framework—hypothesis testing and impact tracking—is essential to realizing a change agent’s full potential. To illustrate, imagine an alternate history in which, a century ago, efforts to maximize automobile fuel efficiency proceeded without systematic measurement or hypothesis testing. Factors such as transmission gear ratios, aerodynamics, and operating temperatures and pressures would go unexamined, making today’s levels of fuel efficiency virtually unattainable.
A similar argument applies to other domains: maximizing crop yields, reducing disease transmission, or achieving successful space flight all depend on systematically testing hypotheses and tracking outcomes. Without such evidence-driven approaches, decisions are guided by intuition rather than data, increasing the likelihood of inefficient or ineffective results. Moreover, realizing maximum performance—whether in fuel efficiency, agriculture, healthcare, space exploration, or change agent impact—requires applying the principles of measurement science: careful tracking and rigorous hypothesis testing.
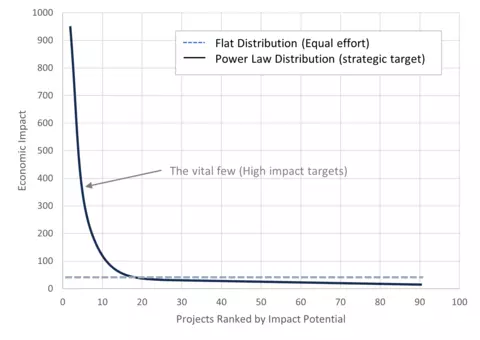
The benefits of hypothesis testing and impact tracking rely on the idea that some change agent investments have a higher return per expenditure dollar than others. The distribution of potential impact likely follows some power law distribution, such as that of the Pareto Principle, which is supported by the returns for investments made by manufacturers (see Fig. 1.3 in NIST AMS 100-80). On the x-axis of Fig. 2.1 from NIST AMS 100-80 are projects ranked from highest impact to lowest. On the y-axis there are potential impacts either in dollars or return on investment. If there is no knowledge about which projects have a higher impact, then the distribution of impact approaches a flatter distribution, as change agents do not know which project to invest resources nor do they know which ones require more resources than others. Alternatively, in a world where we approach perfect information about potential impact, the distribution of impact becomes closer to a power law distribution where impacts are both higher and earlier per dollar of R&D expenditure. To maximize impact per dollar of expenditure, change agents likely need to move further away from the flat distribution toward the power law distribution to capture high return projects by increasing the accuracy of impact predictions.
In addition to the distribution of returns, there are real-world applications of increasing forecast accuracy that result in substantial returns. Although R&D does not equate to baseball, production lines, or package delivery systems, the examples of Moneyball, Toyota, and UPS described below illustrate a narrow principle: that complex systems with interdependent components can benefit from structured feedback, measurement, and iterative updating of decision models under conditions of partial control and uncertainty.
In these systems, decision-makers do not control all relevant variables. For instance, Toyota does not control consumer demand, UPS does not control traffic conditions, and the Oakland A’s do not control player market prices. Instead, they operate by continuously updating decisions based on observed outcomes and feedback signals. Similarly, in applied R&D contexts, while outcomes are more uncertain and attribution is noisier than in engineered systems, decision points still exist where resources are allocated, and projects are selected. At these points, feedback from observed performance can inform future decisions, even if the mapping between actions and outcomes is imperfect and evolving.

The Oakland A’s
The Oakland A’s reduced the cost of winning a baseball game by 77.5 % by increasing their forecast/prediction accuracy. Their methods more accurately predicted the number of wins the team would have with different players, allowing them to more reliably select higher return investments/players. It is important to note that both the new approach and old approach use data. For instance, in the old approach scouts would consult batting average, home runs, or runs batted in, but the new method used the data more effectively. If manufacturing industry change agents were able to reduce the average cost of research impact by a similar percentage as the Oakland A’s experienced in baseball, researchers might increase their impact by 444 % - because a 77.5% reduction in cost means the same budget could produce 4.44 times as much impact assuming a constant cost of impact. This might be achieved by increasing the accuracy of impact predictions for projects, allowing change agents to identify projects that are both affordable and highly impactful.
There are some additional insights that might be gleaned from the MoneyBall example. Billy Beane along with the assistance of Paul Depodesta, a Harvard graduate in economics, are largely credited with the Oakland A’s feat. According to Lewis, Depodesta saw a number of issues in baseball:
“There was, for starters, the tendency of everyone who actually played the game to generalize wildly from his own experience. People always thought their own experience was typical when it wasn’t. There was also a tendency to be overly influenced by a guy’s most recent performance: what he did last was not necessarily what he would do next. Thirdly—but not lastly—there was the bias toward what people saw with their own eyes or thought they had seen. The human mind played tricks on itself when it relied exclusively on what it saw, and every trick it played was a financial opportunity for someone who saw through the illusion to the reality. There was a lot you couldn’t see when you watched a baseball game” (Lewis 2004).
The observation that “the human mind played tricks on itself” is aligned with some of the items discussed in Section 1.4 of NIST AMS 100-80, including overconfidence in one’s knowledge, the effect of extraneous observations, and being sidetracked by information that is only adjacent to the issue at hand. Additionally, Billy Beane’s and Paul DePodesta’s new scientific approach created significant tension/conflict with the scouts for the Oakland A’s, who embraced the previous approaches and strategies. Thus, there were psychological obstacles similar to that discussed in Section 1.4 of NIST AMS 100-80.
Toyota’s Total Production System
Another example of where increased accuracy in predictions resulted in high returns is in Toyota’s Total Production System (Liker 2004). Toyota’s system increases returns by improving prediction accuracy through standardized work, real-time feedback, and pull-based production, which reduce variability and uncertainty in demand and processes, enabling more efficient use of resources and lower costs. These improvements in operational predictability allow Toyota to better match production with actual demand, reducing excess inventory and minimizing downtime. By systematically anticipating potential bottlenecks and variations in the production process, the company can focus resources on more critical efforts such as increasing both productivity and overall value generated per unit of input. This example illustrates that structured forecasting and data-driven decision-making can generate substantial returns in complex operations—paralleling the potential benefits for change agent R&D investments.
UPS’ Orion system
UPS’ Orion system is yet another example of generating impact from increased prediction accuracy (Team Ascend 2025). ORION increases returns by improving prediction accuracy at scale—using standardized operations, real-time data, and continuous learning to reduce uncertainty in routing decisions, which lowers costs and increases productivity. By continuously analyzing routing data and adjusting plans in real time, ORION reduces uncertainty and improves the efficiency of every delivery. The system’s predictive algorithms allow UPS to allocate vehicles and personnel more effectively, minimizing wasted miles and fuel while maximizing on-time performance. This demonstrates how accurate forecasting can scale operational improvements across a complex network—an approach that parallels how change agent R&D could benefit from better prediction of project costs, adoption, and impact.
If improved prediction methods can generate value in sports and logistics, the same principle should apply to change agent manufacturing R&D—provided outcomes are defined, measured, and analyzed. Much of the framework presented in NIST AMS 100-80 is to facilitate system level experiential advancement. Simply put, the framework enables us to learn from the past. Without tracking hypotheses and outcomes, there is limited ability to study the investments and projects that have been executed. As a consequence, decision makers can struggle to systematically identify all of the characteristics of high impact/return investments.
Framework Components, Logic, and Implementation

Credit:
Pixabay
The Framework |

Credit:
Pixabay
Framework Logic |

Credit:
Pixabay
Implementation Infrastructure |
The Framework's Process | Background: Impact Forecasting | Notes and Cautions |
Data Layers and Feed Back Loops | Supporting Logic and Evidence | Standards and Platforms |
Metrics and Units of Observation | Economies of Scale | Modular Adoption |
Collaboration is a key component to reducing change agent costs and enabling compound learning. If you are considering adopting this framework, consider reaching out to the project lead Douglas Thomas, Economist: douglas.thomas [at] nist.gov (douglas[dot]thomas[at]nist[dot]gov)
Any mention of commercial products within NIST web pages is for information only; it does not imply recommendation or endorsement by NIST.