Official websites use .gov
A .gov website belongs to an official government organization in the United States.
Secure .gov websites use HTTPS
A lock (
) or https:// means you’ve safely connected to the .gov website. Share sensitive information only on official, secure websites.
Time and Frequency from A to Z
A440 (sometimes called A4) is the 440 Hz tone that serves as the internationally recognized standard for musical pitch. A440 is the musical note A above middle C. NIST has broadcast A440 from radio station WWV since 1936. The tones can currently be heard during minute 2 of each hour on WWV, and during minute 1 on WWVH.
Tuning a piano is an example of a simple frequency calibration that is done with the human ear. The piano tuner listens to a standard audio tone, compares it to the same note on the piano, and adjusts the piano until it agrees with the audio standard. The smallest frequency offset that a piano tuner can hear depends upon several factors, including the musical training of the listener. However, the just noticeable difference is often defined as 5 cents, where 1 cent is 1/100 of the ratio between two adjacent tones on the piano’s keyboard. Because there are 12 tones in a piano’s octave, the ratio for a frequency change of 1 cent is the 1200th root of 2. Therefore, raising a musical pitch by 1 cent requires multiplying by the 1200th root of 2, or 1.00057779. A 5 cent raise in pitch would require this to be done five times, and would equal 1.3 Hz when starting with a 440 Hz tone.
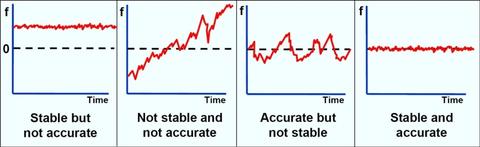
The degree of conformity of a measured or calculated value to its definition, related to the offset from an ideal value. In the time and frequency community, accuracy refers to the time offset or frequency offset of a device. For example, time offset is the difference between a measured on-time pulse and an ideal on-time pulse that coincides with UTC. Frequency offset is the difference between a measured frequency and a nominal frequency with zero uncertainty. The relationship between accuracy and stability is shown in the illustration.
The term uncertainty is usually preferred to accuracy when a quantitative measurement result is reported. Accuracy is often used in a qualitative sense. For example, we might say that an accurate time measurement was made with an uncertainty of 1 microsecond.
An atomic oscillator, usually a hydrogen maser, whose output signal is derived from the radiation emitted by the atom. Most commercially available atomic oscillators are passive frequency standards.
A change in frequency with time due to internal changes in an oscillator. Aging is usually a nearly linear change in the resonance frequency that can be either positive or negative, and occasionally, a reversal in direction of aging occurs. Aging occurs even when factors external to the oscillator, such as environment and power supply, are kept constant. Aging has many possible causes, including a buildup of foreign material on the crystal, changes in the oscillator circuitry, or changes in the quartz material or crystal structure. A high quality OCXO might age at a rate of < 5 × 10⁻⁹ per year, while a TCXO might age 100 times faster.
A non-classical statistic used to estimate stability. This statistic is sometimes called the Allan variance, but since it is the square root of the variance, its proper name is the Allan deviation. The equation for the Allan deviation (with non-overlapping samples) is
$$\sigma_y(\tau)=\sqrt{\frac{1}{2(M-1)}{\sum} ^{M-1}_{i=1}(\overline{y}_{i+1}-\overline{y}_{i})^2}$$
where yi is a set of frequency offset measurements that consists of individual measurements, y1, y2, y3, and so on; M is the number of values in the yi series, and the data are equally spaced in segments τ seconds long. Or
$$\sigma_y(\tau)=\sqrt{\frac{1}{2(N-2)\tau^2}{\sum} ^{N-2}_{i=1}(x_{i+2}-2x_{i+1} + x_i)^2}$$
where xi is a series of phase measurements in time units that consists of individual measurements, x1, x2, x3, and so on, N is the number of values in the xi series, and the data are equally spaced in segments τ seconds long.
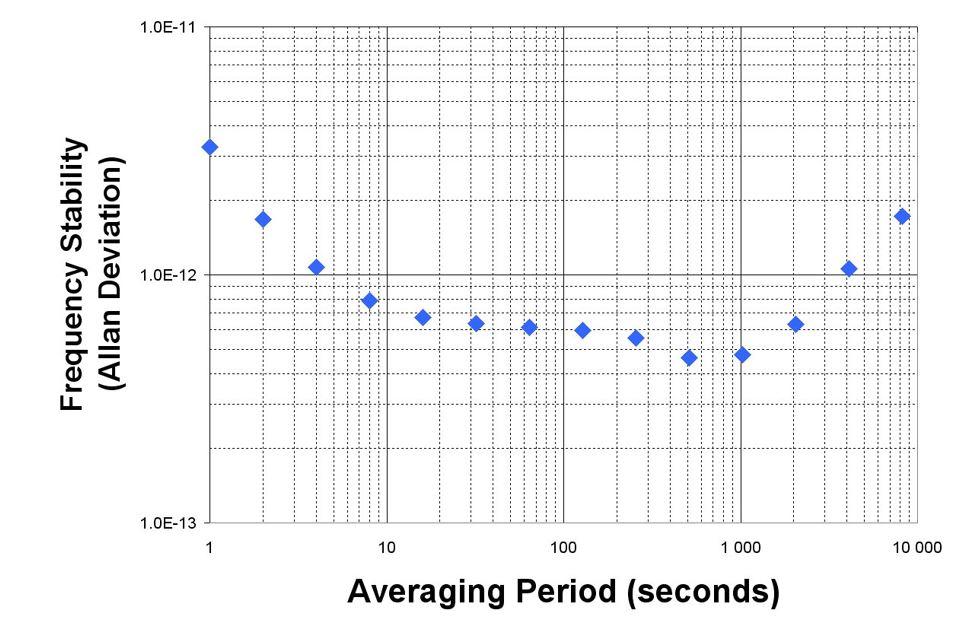
An Allan deviation graph is shown below. It shows the stability of the device improving as the averaging period gets longer, since some noise types can be removed by averaging. At some point, however, more averaging no longer improves the results. This point is called the noise floor, or the point where the remaining noise consists of nonstationary processes such as aging or random walk. The device in the graph has a noise floor of about 5 × 10-13 at τ = 1000 s.
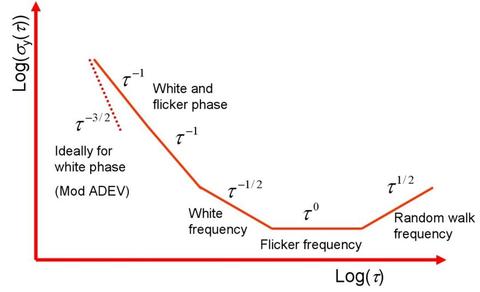
The Allan deviation is also used to identify types of oscillator and measurement system noise. The slope of the Allan deviation line can identify the amount of averaging needed to remove these noise types, as shown in the graph below. Note that the Allan deviation does not distinguish between white phase noise and flicker phase noise.