An official website of the United States government
Here’s how you know
Official websites use .gov
A .gov website belongs to an official government organization in the United States.
Secure .gov websites use HTTPS
A lock (
) or https:// means you’ve safely connected to the .gov website. Share sensitive information only on official, secure websites.
Observations of greenhouse gas concentrations in the atmosphere are the backbone of the analysis system. Emissions lead to elevated concentrations downwind of sources (and reductions downwind of sinks, such as trees, parks, or crops), which are measured directly using various instrumentation methods and platforms. These are used in various analyses to estimate emissions. Observations of meteorological parameters (wind speed or turbulence, for example) are also used either to evaluate transport models or directly in estimation of emissions.
Various types of atmospheric observations are currently used in top-down analyses and flux quantification methods. We currently use mostly ground- and aircraft-based in-situ measurements (see examples below). NIST plans to extend the types of observations we use in our analyses to include both ground-based and space-based remote sensing observations as well as observations from sensors currently being developed (see sensor development). Below are examples of current NIST-supported measurement capabilities.
Atmospheric GHG concentration measurements
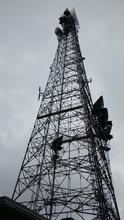
Air monitoring is conducted from communications towers such as this one in Thurmont, MD.
High-precision stationary measurements. In-situ continuous monitoring of GHG concentrations is used in top-down analyses. Their continuous nature allows for GHG flux estimation at long time scales, enabling multi-year analyses of trends and seasonality in emissions.
High-precision airborne measurements. Observations of GHGs made in-situ from airborne platforms cover large spatial areas in short time frames. Analyses using this data can give a snapshot of emissions at a given time for an area ranging from a point-source to an entire city. Examples: FLAGG-MD; ALAR (Purdue University).
Whole air samples (flasks). Whole air samples collected by partners at NOAA’s Global Monitoring Laboratoryare analyzed for multiple trace gas species including isotopes and radiocarbon.
Lower-cost, lower-precision measurements. NIST is developing a robust GHG sensing platform combining off-the-shelf GHG and meteorological sensors to lower costs in comparison with traditional high-precision network. Coupling these lower-cost stations with high precision measurements can provide a denser GHG network throughout a region.
Mini Micro-Pulse Lidar. A particle Lidar can be used to derive planetary boundary layer (PBL) height along with aerosol concentration and cloud height.
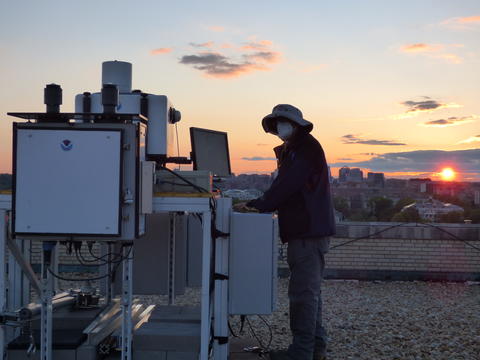
3D Wind Lidar. A Doppler Lidar has recently been installed on the roof of the Department of Commerce’s headquarters in Washington, D.C. More information and data can be found at NOAA’s Chemical Sciences Laboratory.
During a Washington, D.C., sunset on April 16, 2021, NOAA's Scott Sandberg stands next to a newly installed NOAA-NIST lidar system for measuring greenhouse gases atop a weather station on the Department of Commerce’s Herbert Clark Hoover Building.