
Official websites use .gov
A .gov website belongs to an official government organization in the United States.
Secure .gov websites use HTTPS
A lock (
) or https:// means you’ve safely connected to the .gov website. Share sensitive information only on official, secure websites.
Greenhouse Gas (GHG) Flux Quantification
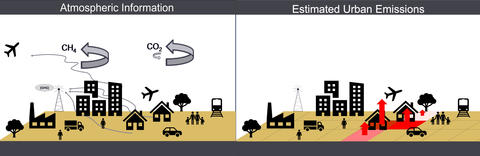
Methods for quantifying GHG fluxes (sources and sinks) are typically classified into two categories, often termed “bottom-up” and “top-down.” Top-down methods use atmospheric measurements to estimate fluxes, while bottom-up methods focus on using process-level understanding.
Top-down flux quantification
Flux estimation methods using atmospheric measurements (i.e., “top-down” methods) use atmospheric GHG concentration observations coupled with either simple or complex models to estimate the emissions or uptake (i.e., flux) from a given region. In any regional top-down analysis it is necessary to isolate the enhancement in the GHG concentration that is caused by fluxes in the region of interest. Thus, a background or baseline concentration must first be subtracted from the total observed concentration (see Karion et al., 2021).
One top-down quantification method is inverse modeling (e.g. Lopez-Coto et al., 2020), described below, but others include mass-balance methods (e.g. Heimburger et al., 2017), tracer-tracer ratio methods, and more.
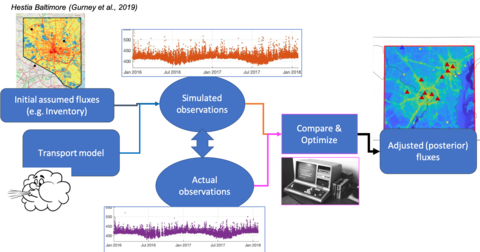
In the inverse modeling paradigm, the Bayesian approach is ubiquitous. Here bottom-up inventories are often assumed as priors along with assumed uncertainties on the prior, which are then updated via a Bayesian way using the atmospheric data with the help of an atmospheric transport model. At NIST, we use such Bayesian inverse modeling approaches and investigate the impact of different model setups on estimated fluxes.
Bottom-up emissions and biogenic models
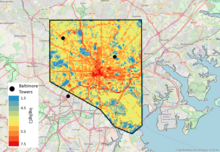
Bottom-up emissions and biogenic flux models use process-level understanding to quantify emissions or uptake. Their development is independent from top-down methods and they are typically used for traditional emissions reporting and accounting (nationally and locally). Gridded bottom-up estimates (i.e., flux maps) can also be used as initial guesses, or priors, for top-down methods. We work with both anthropogenic emissions inventories and biogenic flux models.
References
Heimburger, A. M., R. M. Harvey, P. B. Shepson, B. H. Stirm, C. Gore, J. Turnbull, M. O. Cambaliza, O. E. Salmon, A.-E. M. Kerlo and T. N. Lavoie (2017). "Assessing the optimized precision of the aircraft mass balance method for measurement of urban greenhouse gas emission rates through averaging." Elem Sci Anth 5.
Lopez-Coto, I., X. R. Ren, O. E. Salmon, A. Karion, P. B. Shepson, R. R. Dickerson, A. Stein, K. Prasad and J. R. Whetstone (2020). "Wintertime CO2, CH4, and CO Emissions Estimation for the Washington, DC-Baltimore Metropolitan Area Using an Inverse Modeling Technique." Environmental Science & Technology 54(5): 2606-2614.
Karion, A., I. Lopez-Coto, S. M. Gourdji, K. Mueller, S. Ghosh, W. Callahan, M. Stock, E. DiGangi, S. Prinzivalli and J. Whetstone (2021). "Background conditions for an urban greenhouse gas network in the Washington, DC, and Baltimore metropolitan region." Atmospheric Chemistry and Physics 21(8): 6257-6273.