
Official websites use .gov
A .gov website belongs to an official government organization in the United States.
Secure .gov websites use HTTPS
A lock (
) or https:// means you’ve safely connected to the .gov website. Share sensitive information only on official, secure websites.
U.S. Manufacturing Economy
Applied Economics in US Manufacturing
SUMMARY: In terms of value added, the primary measure of economic activity, the U.S. is the second largest manufacturing nation in the world behind that of China. The U.S. ranking as a brand suggests that it tends to be a differentiator rather than a cost competitor; however, a number of nations rank higher as a brand. The largest manufacturing subsector in the U.S. is chemical products followed by computer and electronic products, as seen in Figure 2.12 of NIST AMS 100-76. Food, beverage, and tobacco products is third.
There are three primary aspects of examining U.S. manufacturing statistics on competitiveness: (1) how the U.S. industry compares to other countries, (2) the trends in the domestic industry, and (3) the industry trends compared to those in other countries. NIST AMS 100-76 provides statistics on these aspects. Below are highlights from this publication. Due to the necessity to use a selection of datasets, there may be minor discrepancies between various statistics. Additional data and statistics can be estimated using NIST’s Manufacturing Cost Guide.
Manufacturing in Brief Some brief figures on U.S. manufacturing include the following:
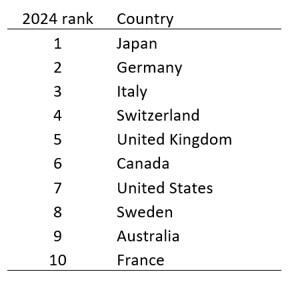
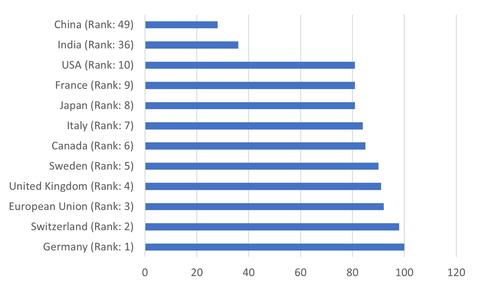
U.S. as a Brand Frequently, countries are discussed as brands. Two rankings provide insight into the U.S. as a brand:
Credit:
Table 5.2: NIST AMS 100-76
Ipsos National Brands Index, 2024
Credit:
Figure 5.11 from NIST AMS 600-16
Made-in-Country Index, 2017 Inflation Inflation has increased in recent years, which diminishes purchasing power.
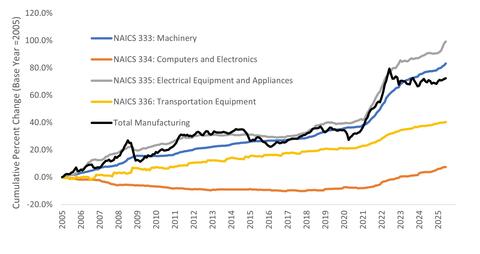
Credit:
NIST AMS 100-76
Inflation - Cumulative Percent Change in the Producer Price Index (Selling Price Received), 2005-2025 Manufacturing Growth
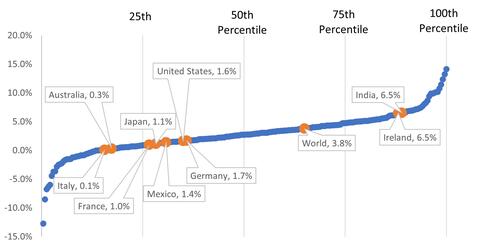
Credit:
NIST AMS 100-76
National 25-Year Compound Annual Growth, by Country (1998 to 2023): Higher is Better Manufacturing Industry Size
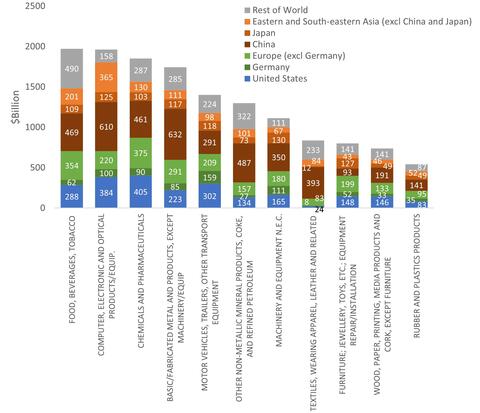
Credit:
NIST AMS 100-76
Global Manufacturing Value Added by Industry, by Country/Region (2020) Productivity

Credit:
NIST AMS 600-16
Manufacturing Total Factor Productivity Index | Methods and Opportunities for Advancing U.S. Manufacturing: Below are change agent opportunities for advancing national manufacturing competitiveness discussed in AMS 100-76.
|
Economic Environment There is no agreed upon measure for examining the environment for research, innovation, and other factors for doing business, but there are a number of common measures, which are discussed below.
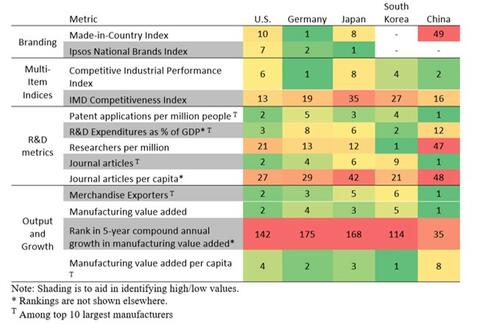
Credit:
NIST AMS 100-76
Rankings for a Selection of Metrics and Countries (Lower is Better) Types of Goods Produced The largest manufacturing subsector in the U.S. is chemical products followed by computer and electronic products. 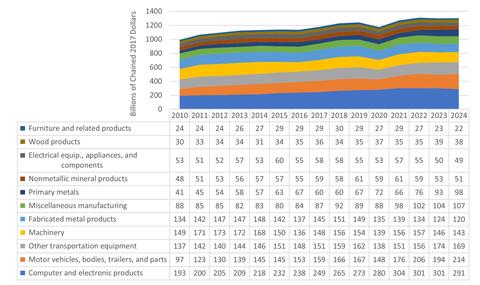
Credit:
NIST AMS 100-76
Value Added for Durable Goods by Type (billions of chained dollars), 2009-2023 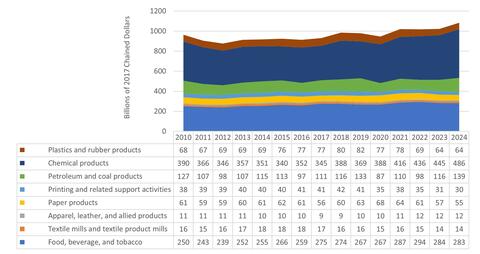
Credit:
NIST AMS 100-76
Value Added for Nondurable Goods by Type (billions of chained dollars), 2009-2023 Manufacturing Safety, Compensation, and Profit
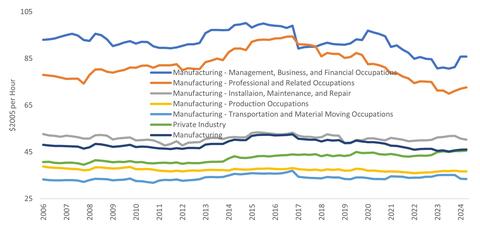
Credit:
NIST AMS 100-76
Employee Compensation (Hourly)
Manufacturing Assets and Supply Chain
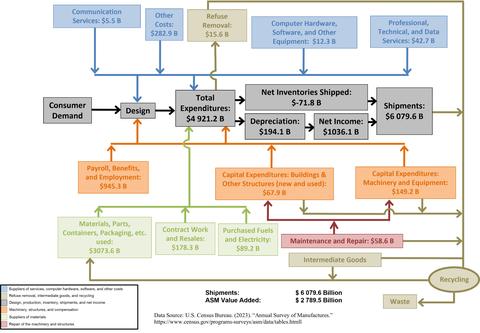
Credit:
Figure 3.1 from NIST AMS 600-16
Manufacturing Supply Chain, 2021 | |
For more information, please see NIST AMS 100-76.
Contacts
-
(301) 975-4918