
Official websites use .gov
A .gov website belongs to an official government organization in the United States.
Secure .gov websites use HTTPS
A lock (
) or https:// means you’ve safely connected to the .gov website. Share sensitive information only on official, secure websites.
The Supply Chain
Applied Economics in US Manufacturing

Optimizing an industry supply chain and reducing losses due to disruption is likely to require advanced knowledge and understanding of supply chain operations. A number of AEO reports and articles characterize the U.S. supply chain.
The U.S. Supply Chain in Brief
- U.S. Direct and Indirect manufacturing value added (i.e., manufacturing and its domestic supply chain) was $4.278 trillion in 2019 (NIST AMS 100-49).
- In 2020, U.S. manufacturing imported 18.2 % of its intermediate goods/services supply chain (NIST AMS 100-49).
- In 2020, 10.6 % of U.S. manufacturing output was of foreign origin (NIST AMS 100-49).
- Frequently, an estimated 80 % of value added originates from 20 % of a supply chain (Thomas and Kandaswamy 2019).
- Manufacturing shipments in 2020 were $5 221.3 billion, which can be broken into a number of supply chain costs:
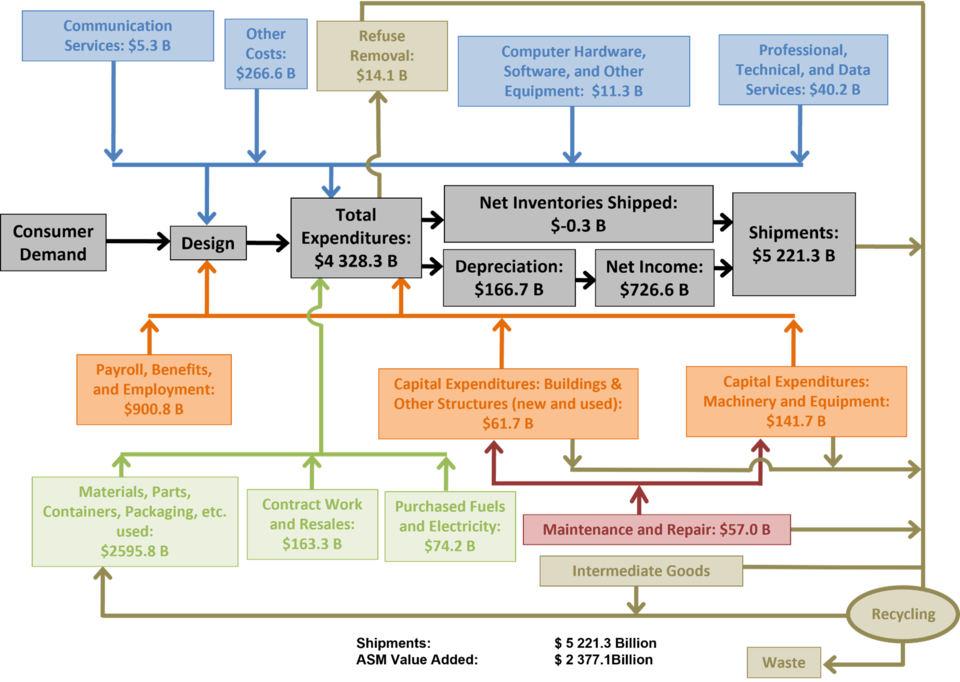

Figure 3.1 from NIST AMS 100-49: Manufacturing Supply Chain, 2020
Supply Chain Flow Time
- Supply chain flow time from raw material extraction to finished product can be months to years. The flow path for automobiles, for instance, is 794 days (NIST TN 1890).
- On average, industry materials and supplies inventory flow, which is typically kept to address uncertainty in deliveries, is 24.8 days
- On average, finished goods inventory flow, which is typically kept to address uncertainty in production and demand, is 27.8 days
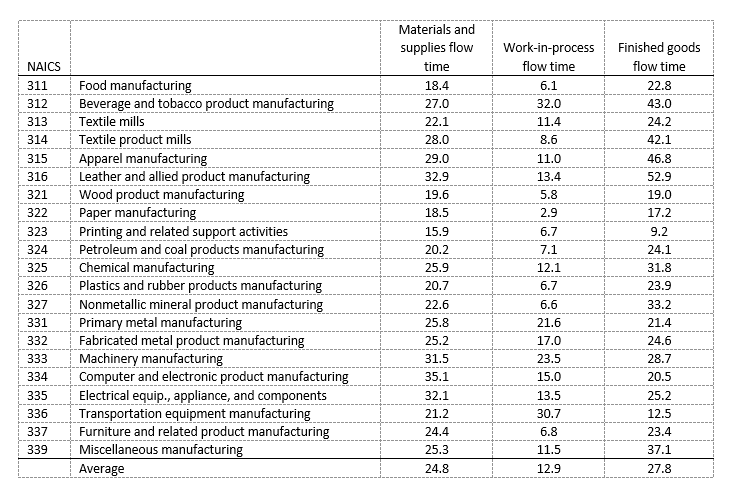
Flow Time by Industry NAICS Code, Based on Methods from NIST TN 1890
Supply Chain Disruption Downstream
(Delays and shortages in supplies)
- Manufacturing payroll is estimated to be suppressed by 2.9 % due to short-term downstream supply chain disruption from natural hazards (Thomas and Helgeson 2021)
- Manufacturing GDP is estimated to be suppressed by 3.9 % due to short-term downstream disruption from natural hazards (Thomas and Helgeson 2021)
- Manufacturing Employment is estimated to be suppressed by 8.6 % due to short-term downstream disruption from natural hazards (Thomas and Helgeson 2021)
- The downstream supply chain effect of power disturbances is 2.3% of manufacturing value added (Thomas and Fung 2022).
MCG tool for Supply Chain Statistics
The Manufacturing Cost Guide (MCG) is a tool that estimates industry statistics for the manufacturing supply chain based on economic input-output analysis. It allows users to estimate value added for an industry and its supply chain. For example, a user could estimate the supply chain components of the automobile manufacturing, which would estimate the value added from all the other industries that is used by the automobile manufacturing industry.
AEO Supply Chain Pages
Optimizing supply chains and reducing disruption losses at the industry level is likely to require advanced knowledge and understanding of supply chain operations. It is often estimated that 80 % of a problem is due to 20 % of the cause and evidence suggests this 20 % can be a target rich environment for high return research investments. AEO supply chain research has three focus areas examining costs and losses in manufacturing:
Cost Mapping | Flow Time Mapping | Supply Chain Disruption
Contacts
-
(301) 975-4918