
Official websites use .gov
A .gov website belongs to an official government organization in the United States.
Secure .gov websites use HTTPS
A lock (
) or https:// means you’ve safely connected to the .gov website. Share sensitive information only on official, secure websites.
Summary
As ‘omics moves into industrial and commercial applications, there is a need for quality and process control to ensure safety and efficacy of products and services, especially when machine learning may be involved. This underscores the need for suitable reference materials certified for their ‘omic profiles. We use informatic techniques to compare spectral data and determine their consensus distribution and uncertainty.
Description
Characterization of omic profile data is essential to quality and process control.
‘Omics is increasingly moving out of the laboratory and towards use in industrial and commercial applications. For instance, in biomanufacturing, there is a need for quality control when developing biotherapeutics, which will almost certainly require a machine-learning classifier to separate acceptable batches of a drug from unacceptable. Likewise, if metabolomic data are to be used for clinical purposes such as precision medicine, machine-learning classifiers are needed to accomplish these ends.
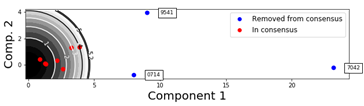
With new applications comes a need for reference materials relevant to these applications, and therefore the need to determine what values to certify and how to measure their uncertainty. This means RMs need to be certified for spectral data, and the NIST processes for estimating uncertainty need to be updated to enable comparisons between different spectra. In this project, we develop software tools to automate the process of comparing spectral data. One such tool, interlab_py (pages.nist.gov/interlab_py), compares data such as NMR spectra from interlaboratory studies, calculates a consensus distribution of the spectra, and identifies those spectra that fall outside the consensus.