
Official websites use .gov
A .gov website belongs to an official government organization in the United States.
Secure .gov websites use HTTPS
A lock (
) or https:// means you’ve safely connected to the .gov website. Share sensitive information only on official, secure websites.
Supply Chains: Flow Time
Flow time from Raw Material to Finished Product Can be Months to Years

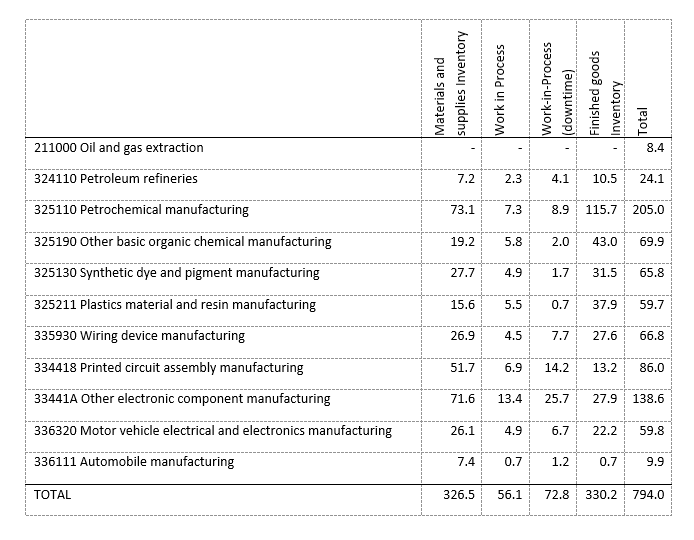
There are numerous flow paths from raw material extraction to the assembled product. For instance, the flow from raw materials to finished automobiles is shown in Figure 4‑1 from NIST TN 1890. This figure provides a diagram of all the NAICS code connections identified for automobile manufacturing. It is a complex diagram that is challenging to follow, illustrating the difficulty in tracking supply chains at the macro scale. The longest flow path that was identified for automotive manufacturing was 794.0 days and is traced in Table 4‑1 from NIST TN 1890. The flow would start in the industry at the top, oil and gas extraction (NAICS 211000), which has an inventory time of 8.4 days. It would then flow to the petroleum refineries (NAICS 324110). It would go through the industry’s materials and supplies inventories, work in process, work in process downtime, and finished goods inventory.
Macro-Level Supply Chain Flow Maps from Economic Input-Output Data and Census Data
The Use table from the BEA Benchmark Input-Output tables provides the items each industry purchases from other industries. This data, however, includes not only the materials, but also the energy, machinery, services, and other items that are not part of the final product. To track the flow time and inventory time, it is necessary to identify only those activities that process materials that are physically part of the final product. To identify these activities, the data from the Use table that applies to manufacturing was extracted. A subset of these items were selected based on their contribution to the industry of interest (e.g., automobile manufacturing and aircraft manufacturing).
Inventory turnover is the number of times inventory is sold or used in a time period such as a year. It is calculated as the cost of goods sold (“COGS” or “throughput”) divided by the average inventory. The throughput is usually stated in yearly terms. Academics use inventory turnover ratios in studying a number of fields, like distributive trade. The Annual Survey of Manufacturing has data to calculate the cost of goods sold. It is the sum of payroll; benefits; materials; depreciation; capital expenditures; rental payments; other expenses; and beginning of year inventories less end of year inventories. Inventories are calculated as the average of the beginning of year inventories and end of year inventories. The Annual Survey of Manufactures provides data on total inventories, material and supplies inventories, work-in-process inventories, and finished goods inventories by NAICS code. The days that a dollar spends in each of these inventories can be calculated by taking the total number of days in a year and dividing it by the number of inventory turns. One item that this calculation excludes is the down time for work-in-process; that is, the time that a good is in work-in-process but the factory is actually closed. To make this calculation we use data from the Quarterly Survey of Plant Capacity Utilization, which provides the average plant hours by NAICS code. This data can be used to estimate the proportion of work-in-process time that is actually down time.
Flow Time Affects Productivity
Research in NIST AMS 100-25 suggests that flow time innovations have a significant impact on multifactor productivity and production. That is, manufacturers can increase productivity through flow time or lose productivity through increases in flow time, as might be expected. The more significant findings are in regards to the magnitude of impact of flow time. A simulated 20 % decrease in work-in-process flow time results in a 1.21 % increase in multifactor productivity and a 2.23 % increase in value added. A simulated 20 % decrease in material and finished goods flow time increases productivity by 0.29 % and increases value added by 2.80 %. These changes may seem small; however, the average industry’s work-in-process flow time from 2005 to 2015 increased 98.8 %. During this same period, multifactor productivity declined an average of 2.2 %. If flow time had remained unchanged from 2005, however, multifactor productivity would have increased between 1.73 % and 3.38 % through other factors, according to our model.
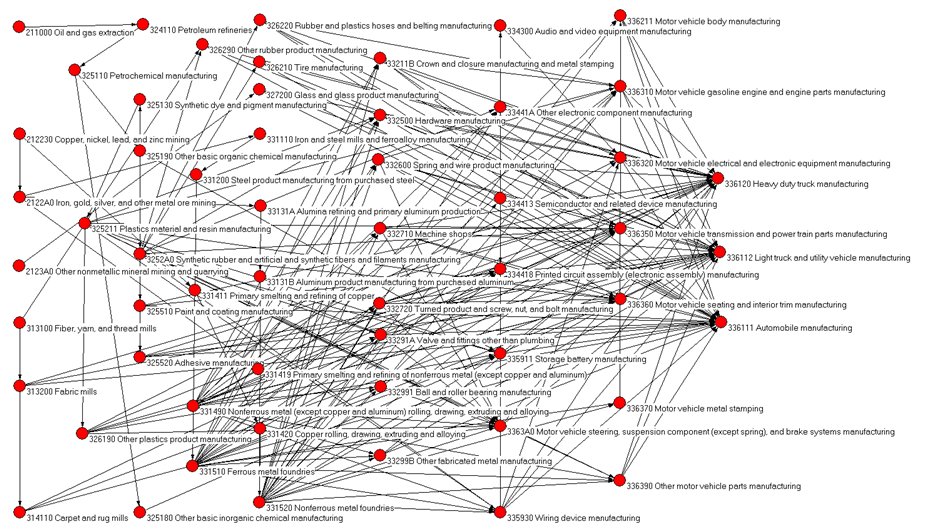
Table 4 1 from NIST TN 1890: Longest Flow Path for Automobile Manufacturing
For more information, see the NIST research below:
- Flow Time Innovations: The Effect on Productivity and Production in U.S. Manufacturing. This paper examines the impact that innovations in material, finished goods, and work-in-process flow time have on productivity and production, measured using the multifactor productivity index and manufacturing value added.
- An Examination of National Supply-Chain Flow Time. This paper utilizes data on manufacturing inventory along with data on inter-industry interactions to develop a method for tracking industry-level flow time and identifying bottlenecks in U.S. manufacturing. As a proof of concept, this method is applied to the production of three commodities: aircraft, automobiles/trucks, and computers.
- Inventory and Flow Time in the U.S. Manufacturing Industry. This report identifies and reviews data on manufacturing inventory and flow time along with data on inter-industry interactions. It then develops a method for tracking the flow time of U.S.
Contacts
-
(301) 975-4918