
Official websites use .gov
A .gov website belongs to an official government organization in the United States.
Secure .gov websites use HTTPS
A lock (
) or https:// means you’ve safely connected to the .gov website. Share sensitive information only on official, secure websites.
Supply Chain Cost Mapping
Efficiency Improvements in High-Cost High-Environmental Impact Supply Chain Points Can Have a Disproportionally Higher Return on Investment
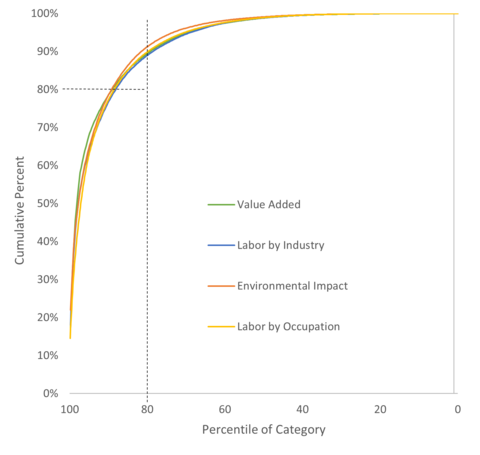
National governments, universities, and other change agents invest in research and development to advance efficiency and spur economic growth. There are, however, few studies that identify where investments will have the largest possible return on investment. This lack of research can result in the funding of investments with suboptimal returns. To identify high-return areas of research, efforts need to be taken to include both the production and use of a product. We have conducted a number of examinations that demonstrate that supply chain costs follow the Pareto principle, which posits that roughly 80 % of a problem is due to 20 % of the causes. This relationship applies to supply chains, including the distribution of value added, labor costs, and environmental impact, as demonstrated in Figure 2 from Thomas et al (2017). The x-axis is the percentile of the supply chain categories (e.g., NAICS code) while the y-axis is the cumulative cost/impact. The results show that a small number of items (shown on the x-axis) represent a large percent of the costs/impacts (shown on the y-axis).
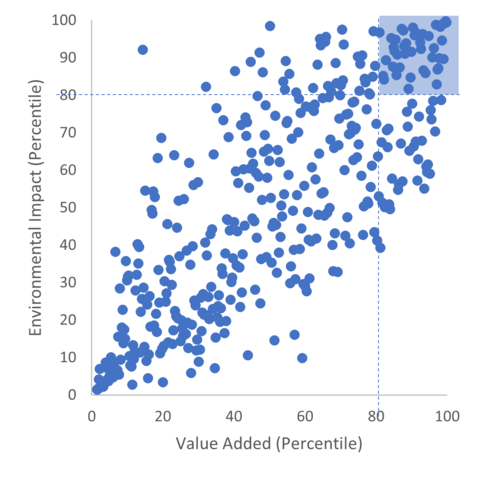
We examined the life-cycle cost of passenger ground transportation as a proof of concept to identify those items that have both a high cost and high environmental impact. Public research that focuses on these items has the potential to be more economical than other areas. We use U.S. input-output data from the U.S. Bureau of Economic Analysis, data from the American Time Use Survey, and environmentally extended input-output data to examine the supply chain for production and use of ground transportation equipment. This is unique in that it identifies the costs, some of which are not documented in GDP (i.e., uncompensated time use), along with the environmental impacts of producing and using a class of manufactured goods. Forty-three industries were identified as being above the 80th percentile for both value added and environmental impact, as illustrated in Figure 3 from Thomas (2018). This approach can be applied to other industries to identify potentially high return research areas.
A Small Proportion of Investments Represent a Large Proportion of the Return
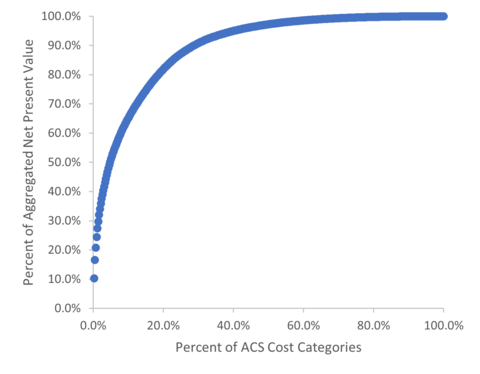
Manufacturers and manufacturing research organizations make investments to advance efficiency and competitiveness. Understanding the return for previously made investments can guide both manufacturers and researchers in identifying future investments with a high return. We examined trends in data from U.S. Department of Energy Industry Assessment Centers, which make technical assessments to reduce waste at small and medium sized manufacturers, to facilitate identifying potentially high return investments for manufacturers and researchers. The results show that the net present value is disproportionally distributed among investments, where 20 % of the investment categories represent 82 % of the net present value (i.e., net benefits), which is consistent with the Pareto principle. For individual investments, 20 % of the cumulative investment cost accounts for 74 % of the net present value.
The value added items and the environmental impacts shown in Figure 3 correlate with a coefficient of 0.78, suggesting that production costs and environmental impacts can be reduced simultaneously. Regression analysis identified those investments with a high return when controlling for a selection of factors. The results suggest that over time, the average Internal rate of return (IRR) decreases, larger firms tend to receive higher IRR, and some investment categories tend to have higher IRR than others. The highest IRR investments were related to “bottleneck reduction,” “scheduling,” and “just-in-time” inventory. The highest concentration of net present value was found in “heat recovery” with the second highest concentration being in “cogeneration” and the third highest in “lighting.” The most common high IRR investment type that was statistically significant in a regression analysis was related to “heat recovery” with the second relating to “space conditioning” and the third most common was related to “cogeneration.”
Patterns in Costs, Impacts, and Return on Investment Can be used to Increase the Return on Public Research
NIST AMS 200-8 is a guide was assembled to aid change agents, such as research and trade organizations, in evaluating potential research and development investments in the manufacturing industry. It includes an overview of the primary methods used for evaluating investments in manufacturing technologies along with tailoring methods for change agent investments. The process presented in the guide has 5 steps with each step having a section of the guide dedicated to it.
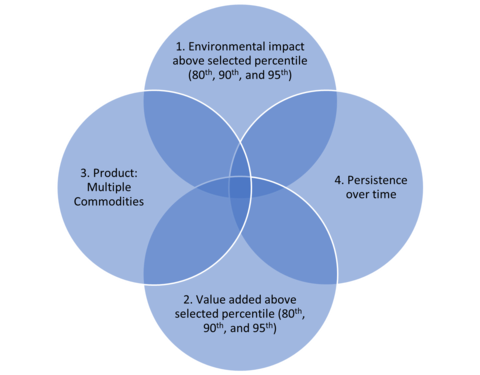
It discusses how some cost areas span across multiple cost/impact categories. For instance, there are a number of cost areas for automobile manufacturing that are above the 80th percentile in value added (i.e., cost), environmental impact, and labor hours. It also discusses using cost/impact areas that span across time (i.e., they are persistent) and commodities, as illustrated in Figure 5 from AMS 200-8. Change agents can identify research projects that span across impact/cost categories, across commodities, and across time. These projects are likely to have significant impacts on society, as they have substantial effects on items that have continuously had a high cost/impact and affect multiple stakeholders.
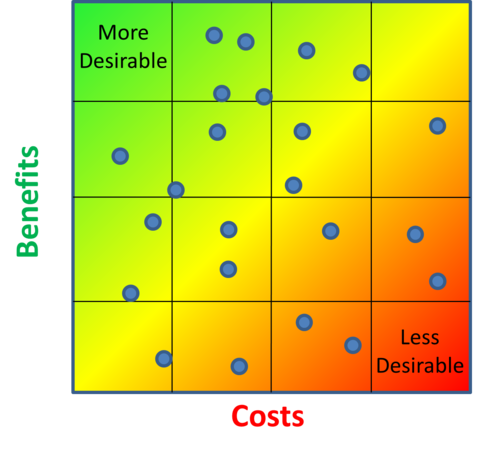
One of the steps in identifying high return research investments that change agents can make in manufacturing, is to identify broader cost research areas that will have a high potential for having substantial return on investment. It is not technically feasible to identify all possible change agent investments in manufacturing; however, one can increase the probability of identifying a selection of investments that have a high return when compared to all the known and unknown potential investments. To illustrate, suppose that Figure 2 from AMS 200-8 plots the costs and benefits for all the potential projects, known and unknown, for change agent investment in manufacturing. To have the largest impact possible, a change agent would want to identify as many projects as possible that are in the top left of this figure where there are low costs and high benefits. If projects are randomly selected or, worse, biased toward those in the lower right of the figure, it will result in a lower return on investment than might otherwise have been achieved. Moreover, the selection of potential research projects should not be left to chance, but rather be oriented toward potentially fruitful areas.
The NIST Manufacturing Cost Guide can be used to Identify High Costs/Impact Areas of Manufacturing
The Manufacturing Cost Guide is a tool that estimates the costs that U.S. manufacturers face and can be used to help gauge the potential returns on manufacturing industry research projects through cost reductions. The tool can be used to answer questions such as:
- An organization is conducting research to reduce redundant engineering labor. How much do manufacturers spend on engineering?
- A researcher is proposing a project to reduce the use of steel by advancing material standards, thereby, reducing scrap caused from material deficiencies. How much do manufacturers spend on steel?
For More Information, See the NIST Research Below:
- Identifying High Resource Consumptions Supply Chain Points: A Case Study in Automobile Production. This paper examines the life-cycle cost of passenger ground transportation as a proof of concept to identify those items that have both a high cost and high environmental impact. Public research that focuses on these items has the potential to be more economical than other areas.
- Identifying High Resource Consumption Areas of Assembly-Centric Manufacturing in the United States. This paper examines supply chain value added in the U.S. for producing assembly-centric products, which includes machinery, computers, electronics, and transportation equipment, and determines whether costs are disproportionally distributed. The implication being that reductions in resource consumption in some cost areas can disproportionally reduce total resource consumption.
- Life-Cycle Cost of Manufactured Goods: A Case Study in U.S. Ground Passenger Transportation. This paper examines the life-cycle cost of passenger ground transportation as a proof of concept to identify those items that have both a high cost and high environmental impact. Public research that focuses on these items has the potential to be more economical than other areas. This paper uses U.S. input-output data from the U.S. Bureau of Economic Analysis, data from the American Time Use Survey, and environmentally extended input-output data to examine the supply chain for production and use of ground transportation equipment. This paper is unique in that it identifies the costs, some of which are not documented in GDP (i.e., uncompensated time use), along with the environmental impacts of producing and using a class of manufactured goods.
- U.S. Manufacturing Value Chain: An International Perspective. This report uses input-output data from the World Input-Output Database to track the intermediate goods and services used in national manufacturing industries. Specifically, it examines the extent that supply chains increasingly involve imports and the extent that this trend has changed for the U.S. and other countries.
- Tracking Industry Operations Activity: A Case Study of U.S. Automotive Manufacturing. This report identifies data on manufacturing activity and provides a model for tracking operations activity. The method is then illustrated in the automotive manufacturing industry.
- Reliability of using Periodic IO Data to Identify High Return Investments in Efficiency and Environmental Sustainability: An Examination of U.S. Manufactured Tech Products: This paper identifies industries within the supply chain for 50 high-tech assembly-centric commodities that have pervasive costs and environmental impacts. Previous examinations have shown that expenditures for research and development in high economic cost areas (e.g., the cost of metal for producing a vehicle) tend to have a higher return on investment than expenditures on low cost areas.
Contacts
-
(301) 975-4918