
Official websites use .gov
A .gov website belongs to an official government organization in the United States.
Secure .gov websites use HTTPS
A lock (
) or https:// means you’ve safely connected to the .gov website. Share sensitive information only on official, secure websites.
2013-2014 Year to Date NZERTF Monthly Energy Consumed and Generated
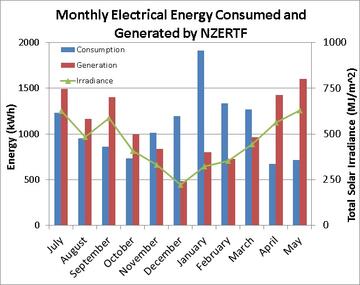
The chart above gives the energy consumed (blue bar) and the energy generated (red bar) by the NZERTF on the monthly basis. When the height of the red bar exceeds the height of the blue bar, the house produced more energy than it consumed and the difference was exported to the electric grid. If the height of the blue bar exceeds the red bar, the house consumed more energy than it generated and the difference was imported from the electric grid. The green triangles represent the monthly total solar irradiance incident on the NZERTF's photovoltaic array.