
Official websites use .gov
A .gov website belongs to an official government organization in the United States.
Secure .gov websites use HTTPS
A lock (
) or https:// means you’ve safely connected to the .gov website. Share sensitive information only on official, secure websites.
MAGIK experiment
Composition Depth Profile in Hydrated
Polymer Electrolyte Films
Summer School on Neutron Small Angle Scattering and Reflectometry
NIST Center for Neutron Research
July 19-23, 2018
Joe Dura, Eric Rus, Brian Maranville, Paul Kienzle
Abstract
Neutron Reflectometry with isotopic substitution will be used to determine the water volume fraction and polymer SLD, independent of any assumptions, in thin films of Nafion. The objective of these measurements is to provide hands on experience in neutron reflectometry data collection, reduction, fitting and subsequent analysis. In doing so, the student will gain insights into the capability of neutron reflectometry to determine the composition depth profile of a variety of thin film samples and the design of reflectometry experiments.
1 Objectives
The objectives of this experiment are to:
-
Determine the depth profile of scattering length density, SLD, in a thin film of Nafion deposited on the native oxide, SiO2 on a Si substrate in the presence of water vapor at relative humidity, RH=92% in both H2O and D2O, and at RH=0% after drying.
-
Use the concept of contrast variation to determine the depth profiles both of the water volume fraction and of the solid polymer SLD.
-
Learn how to perform a neutron reflectometry experiment, including planning, sample preparation, data collection, reduction, fitting, analysis, and interpretation.
-
Gain experience that will allow one to determine how to apply neutron reflectometry to one’s own research interests.
2 Introduction
Nafion is the most widely used polymer electrolyte membrane material because of its thermal stability, chemical stability, and superior performance as a proton transport media - with high proton conductivity and low fuel and oxygen crossover. This polymer consists of a hydrophobic fluorocarbon backbone with a flexible perfluorinated vinyl ether side chain terminated by a sulfonic acid group, with the chemical formula given below.
$$ \begin{aligned} ─ [( &\mathrm{C} \mathrm{FCF_2}) ( \mathrm{CF_2CF_2)_m}] ─ \\ &\,| \\ \mathrm{O} &\mathrm{C} \mathrm{F_2CFOCF_2CF_2SO_3H} \\ &\phantom{\mathrm{CF_2}}\,| \\ &\phantom{\mathrm{CF_2}}\mathrm{CF_3} \end{aligned}
$$
In the presence of water, these two components will phase segregate into water rich and water poor domains. Small angle neutron scattering, SANS, and small angle x-ray scattering, SAXS measurements have determined that these domains consist of cylinders of water in a fluorocarbon matrix with the sulfonic acid decorating the interface. The exact structure of these phases is still debated in the literature, including interconnected networks of inverted micelle clusters, [1] cylinders with either polymer [2] or water [3] in the center, branched
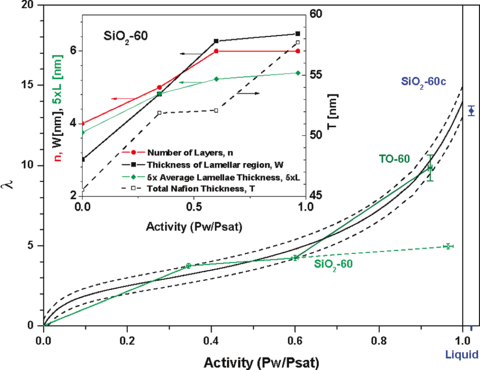
cylindrical domains [4, 5] and bundles of parallel cylindrical water clusters[6]. Conductivity of the H+ ion in fuel cells occurs by ion hopping from one sulfonic acid to the next, down the chemical potential gradient, aided by the reptation of the polymer backbone. The sorption isotherm, or number of water molecules per sulfonic acid, λ, vs. activity (or relative humidity, RH) is roughly linear from RH=10% to RH=60% then increases rapidly beyond this to λ≈14 or a water volume fraction V=0.2 (for equilibration times on the order of hours to days) as seen in the solid line of Figure 1. This large slope of volume fraction of water vs RH requires precise control of the humidity so that the sample thickness remains constant to within the resolution of NR during the time required for a given measurement (~0.2 to 1 days).
Although one typically considers polymer electrolytes in terms of their function in a fuel cell membrane i.e. to promote ion conductivity while preventing fuel and oxidizer cross over, it is important to study thin films of polymer electrolytes because they also are present in devices as an ionically conductive binder, which coats the electrode/catalyst particles. Here, the structure at interfaces in intimate contact with the electrodes are of vital importance because the oxidation and reduction reactions at the catalysts are controlled by the mass transport to them through the Nafion binder, which can be extremely sensitive to the composition and structure at these interfaces.
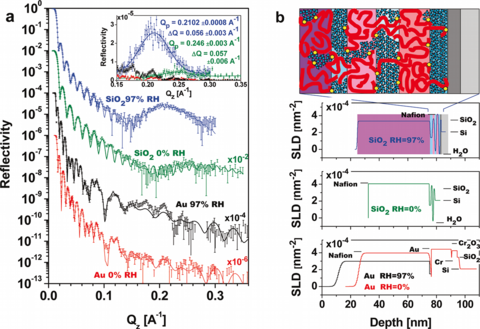
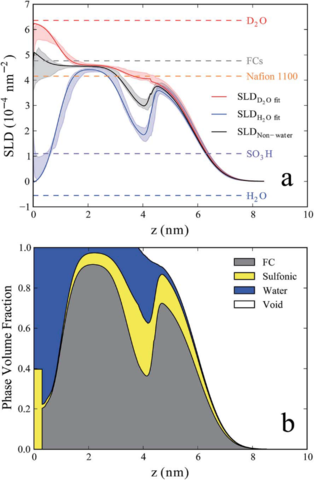
Hydrophilic surfaces such as SiO2 induce a different nano-phase morphology, where, instead of cylindrical domains, a lamellar phase occurs, beginning with a water rich layer at the interface followed by a Nafion rich layer, which is repeated with decreasing composition variations until a bulk-like average composition is achieved after roughly 5 layers (Fig.2) [7]. At less hydrophilic metallic surfaces like Au [7] and Pt [8] or on hydrophobically prepared organo-silicate glass [9] only a single water rich layer is observed at the interface. By using isotopic substitution of the water, the water volume fraction as a function of depth was determined independent of any assumptions about the polymer density or composition [10]. Furthermore, the polymer SLD as a function of depth was determined, which was interpreted in terms of the moieties that Nafion is made of, and thus the depth profile of the sulfonic acid and the fluorocarbon volume fractions was also determined (Fig.3) [10]. Additionally, the depth profile of water was investigated as a function of film thickness and three regimes were discovered. In the Lamellar Regime the sample is truncated at thicknesses that include only lamellae, which have moderate water uptake. In the Thin Film Regime, an additional non-lamellar layer (with thickness up to Nafion’s radius of gyration, Rg, in this regime) occurs on top of the lamellar region. The water uptake of this layer increases linearly with its thickness and the lamellar region maintains a slightly higher water uptake. In the Thick Film Regime where the layer on top of the lamellae exceeds Rg, it has bulklike water uptake, while the lamellae have much higher water uptake [11].
This experiment will investigate the non-water SLD profile that occurs for a thicker Nafion film in high Humidity and compare that to the SLD profile measured at RH=0% after the film has been dried. This system will serve as a general example for the determination of interface structures in polymer/liquid mixtures a on a selected surface.
3 Experimental
3.1 Sample Preparation
Sample preparation is beyond the scope of this summer school; however, it will be described herein as background information. An as received Si substrate (5mm thick and 76.2mm diameter) was cleaned using a detergent and rinsed with DI water until highly hydrophilic. (This thickness is typically chosen for NR experiments to limit the degree of substrate warping that can affect the measured reflected intensity, especially at very low angles.) The excess water was physically removed for the surface with a jet of N2 gas. Thin film samples of Nafion were immediately spin coated from commercial Nafion dispersion diluted with HPLC grade ethanol to a concentration which has been determined (along with the spin rate) to produce the desired thickness of Nafion. The sample was vacuum annealed at 60 °C for one hour to both ensure adhesion of the Nafion to the substrate and to reproduce a sample thermal history consistent with previous investigations.
3.2 Sample Environment
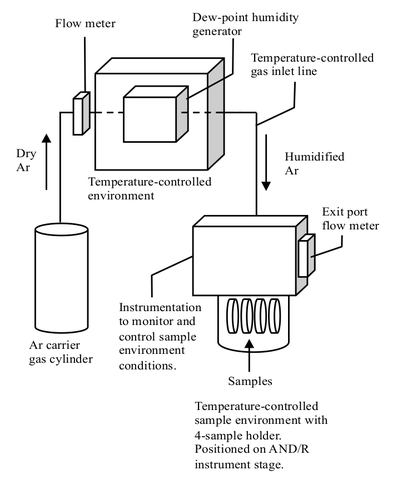
The sample will be measured under three humidity conditions. Because the water uptake of Nafion varies considerably with small variations in RH at high humidity, care will be taken to maintain stable and reproducible control of the thermal environment and humidity, using a specially designed controlled-humidity sample environment [10] shown schematically in Figure 4. All surfaces in the carrier gas path (other than the sample) are actively controlled at a constant temperature via K-type thermocouples and resistance heaters to maintain temperatures well above the dew point. Dry Ar carrier gas first passes through a dew point generator, DPG, which itself is housed inside a controlled-temperature enclosure. The flow-rate is typically controlled between 150 and 300 cm3/minute via a needle valve, based upon observations of a flow-meter positioned at the entrance of this DPG enclosure. (A similar flow meter at the outlet is used to confirm this rate and to verify that there is positive flow throughout.) From the DPG, the humidified gas travels through a heated line to the sample environment, which is a temperature-controlled Al cylinder (Al transmits neutrons with very little attenuation) positioned on the goniometer stage of the reflectometer. Resistive heaters are attached above and below the neutron window (a section of the Al cylinder with thinner walls) to minimize temperature gradients. Control instrumentation, including gas inlet and outlet, an in-line RH sensor in the gas outlet, a flow meter at the gas outlet for leak detection, as well as electrical feedthroughs for temperature measurement and control, are housed on a flange which lies above and seals the sample cylinder. This flange is surrounded by a temperature-controlled enclosure.
Up to four samples can be held in the sample environment at one time, and are kept in good thermal contact with the sample heater by polished aluminum clamps mounted to a Cu block at the top flange of the sample can. The sample temperature is controlled by simultaneous heating (via a resistive cartridge heater attached to the Cu block at the sample mount which is actively controlled using a Pt thermometer) and cooling (via coolant loop filled with an ethylene glycol/water mixture maintained at a constant temperature by a water chiller). The sample temperature is monitored via a calibrated Cernox sensor attached to one of the samples by a clamp with a polished mating face, placed outside of the neutron beam path. The combined heating and cooling keeps the sample temperature stable to within ± 0.02 °C of the set point. The Cernox sensor is accurate to within ± 0.04 °C; additional uncertainty due to the electronic uncertainty of the Lakeshore 340 controller brings the overall sample temperature uncertainty to ± 0.2 °C.
The RH at the sample is determined by two methods, which agree to within the experimental uncertainty: (i) comparison of the specified dew point and the sample temperature, and (ii) via an RH probe (Rotronics) positioned within the sample can, which is properly adjusted for the difference in temperatures between the sample and the RH probe. The DPG maintains the dew point with a stability of ± 0.01 °C and an uncertainty of ± 0.2 °C. The overall RH uncertainty is therefore 1.5% for this experiment.
For the first team’s measurement, the sample will be equilibrated at RH=92% in H2O vapor at a temperature of 30°C. Then without exposing the sample to air it will be dried at 60°C under dry flowing Ar, and cooled to the same 30°C for the second team’s measurement. The third measurement will be done after equilibration in D2O at RH=92%.
3.3 Neutron Reflectometry Data Acquisition
A full description of ANDR, a typical neutron reflectometer, and the precursor to Magik, can be found in the literature [12]. Samples will be aligned first in transmission mode, i.e. with the detector in the direct incident beam. The sample surface will first be centered in the beam by translating the sample and placing it at the position of the minimum in the transmitted beam intensity (caused by reflection of the beam away from the detector). The correct surface can be inferred both by the order of occurrence of the two surface reflections and by the fact that the transmission through the Si substrate is less than through the vapor. Next, scanning the sample angle will result in a peak in intensity when the sample is parallel to the beam because the surface reflects the least at this angle. Depending on the results, these two scans may be repeated for better alignment. The sample alignment will then be refined in reflection mode by setting the sample angle to slightly below the critical angle of the Si substrate and positioning the detector at twice this angle. The sample angle, sample translation, and sample tilt will be iteratively scanned and set at the peak in reflected intensity, since reflection is maximized when the surface normal bisects the incident and reflected beams and the sample surface is centered in the beam. These scans will be iterated until the changes in peak position of subsequent fits correspond to a difference of a few percent in the reflected intensity.
NR data will be collected in a series of scans each with a limited Q range. Raw specular scans will be repeated and compared to determine when the sample has reached equilibrium hydration, as indicated by no statistically significant changes in the NR (primarily swelling induced changes in oscillation period). Once the NR shows no changes between scans they can be combined for better counting statistics, and two sets of background scans (with the detector at 2.5 and 1.5 times the sample angle) will be measured. Group 2 will also measure a slit scan, in which the slits vary as during the specular and background scans but the sample is translated out of the beam and the detector is fixed in the direct incident beam. Additional details can be found in the literature, see e.g. descriptions of NR measurements in the supplemental information to a study of the SEI layer in Li-ion batteries [13].
3.4 Neutron Reflectometry, Data Reduction, and Fitting
Data reduction will determine the absolute specular reflectivity by subtracting the averaged background scans from the specular scans and then normalizing by the incident intensity. The counting statistics of these individual measurements are propagated through the reduction to determine uncertainty of the reflectivity (as one standard deviation). The specular reflectivity for each of the three measurements will be individually fit by each team using the NCNR fitting software, Refl1d, described elsewhere [13, 14].
3.5 Data Analysis: Determining Water Volume Fraction and Non-Water Phase SLD From Fitted SLD Profiles
If the sample is considered to be a mixture of only “water” and “non-water” phases, then its SLD is:
$$SLD_{fit,k}(z) = V_{Water}(z) \times SLD_{known,k} + \left[1-V_{Water}(z) \right ] \times SLD_{Non-Water}(z) \tag{1}$$
Where SLDfit,k(z) is the fitted SLD at depth z for humidifying vapor isotope k (k = H2O or D2O) and SLDknown,k is the known bulk SLD for the isotope k. Assuming equal uptake of H2O or D2O for the same RH, (i.e. \(V_{Water}(z)\) is the same for either isotope) enables analytical calculations of the depth profile of the water volume fraction, \(V_{Water}(z)\), and the SLD of the “non-water” phase, \(SLD_{Non-Water}(z)\). Subtracting the two versions of Eq. 1 for each isotope gives:
$$V_{Water}(z) = \frac{SLD_{fit,H_2O}(z) - SLD_{fit,D_2O}(z)}{SLD_{known,H_2O} - SLD_{known,D_2O}} \tag{2}$$
The assumption of equal water uptake will be verified by comparing the thickness of the sample in both water vapor isotopes. Similarly, by adding the two versions of Eq.1 for each isotope one can determine the SLD profile of the “non-water” portion as a function of depth, which as expected for small volume fractions of water, we see approaches the average of the measured isotopic SLD depth profiles for low water content.
$$ SLD_{non-water}(z) = \frac{SLD_{fit,H_2O}(z) + SLD_{fit,D_2O}(z)}{2} \times \frac{1}{V_{Water}(z)} - \frac{SLD_{known,D_2O}-SLD_{known,H_2O}}{2} \times \frac{V_{Water}(z)}{(1-V_{Water}(z))} \tag{3}$$
By substituting \(V_{Water}(z)\) from eq. 2 into eq. 1 (for either isotope), one can also determine \(SLD_{Non-Water}(z)\) from only known and measured quantities, without the derived value of \(V_{Water}(z)\).
$$ SLD_{non-water}(z) = \frac{SLD_{fit,H_2O}(z) SLD_{known,D_2O} - SLD_{fit,D_2O}(z) SLD_{known,H_2O} }{[SLD_{known,D_2O} - SLD_{known,H_2O}] - [SLD_{fit,D_2O}(z) - SLD_{fit,H_2O}(z)]} $$
This will be compared to the SLD measured for the dehumidified sample and to the value calculated for the assumed density of dry Nafion.
References
1. Gierke, T.D., G.E. Munn, and F.C. Wilson, The Morphology In Nafion Perfluorinated Membrane Products, as Determined by Wide-Angle and Small-Angle X-ray Studies. Journal of Polymer Science Part B-Polymer Physics, 1981. 19(11): p. 1687-1704.
2. Rubatat, L., G. Gebel, and O. Diat, Fibrillar structure of Nafion: Matching Fourier and real space studies of corresponding films and solutions. Macromolecules, 2004. 37(20): p. 7772-7783.
3. Cui, S.T., et al., A molecular dynamics study of a nafion polyelectrolyte membrane and the aqueous phase structure for proton transport. Journal of Physical Chemistry B, 2007. 111(9): p. 2208-2218.
4. Kim, M.H., et al., SANS study of the effects of water vapor sorption on the nanoscale structure of perfluorinated sulfonic acid (NAFION) membranes. Macromolecules, 2006. 39(14): p. 4775-4787.
5. Kubo, W., et al., Imaging of Ionic Channels in Proton Exchange Membranes by the Nickel Replica Method. Journal of Physical Chemistry C, 2010. 114(5): p. 2370-2374.
6. Schmidt-Rohr, K. and Q. Chen, Parallel cylindrical water nanochannels in Nafion fuel-cell membranes. Nat. Mater., 2008. 7(1): p. 75-83.
7. Dura, J.A., et al., Multilamellar Interface Structures in Nafion. Macromolecules, 2009. 42(13): p. 4769-4774.
8. Murthi, V.S., Dura, J.A., Satija, S.K., and Majkrzak, C.F.,Water Uptake and Interfacial Structural Changes of Thin Film Nafion (R) Membranes Measured by Neutron Reflectivity for PEM Fuel Cells, Eds: Fuller T; Shinohara K; Ramani V; Shirvanian P; Uchida H; Cleghorn S; Inaba M; Mitsushima S; Strasser P; Nakagawa H; Gasteiger HA; Zawodzinski T; Lamy C, Proton Exchange Membrane Fuel Cells 8, PTS 1 AND 2 Book Series: ECS Transactions 2008 (16)p. 1471-1485.
9. Kim, S., et al., Surface-induced nanostructure and water transport of thin proton-conducting polymer films. Macromolecules, 2013. 46(14): p. 5630-5637.
10. Steven C. DeCaluwe, Paul A. Kienzle, Pavan Bhargava, Andrew M. Baker, Joseph A. Dura, Phase segregation of sulfonate groups in Nafion interface lamellae, quantified via neutron reflectometry fitting techniques for multi-layered structures, Soft Matter 10, 5763 (2014) [DOI:10.1039/c4sm00850b]
11. Steven C. DeCaluwe, Andrew M. Baker, Pavan;Bhargava, John E. Fischer, and Joseph A. Dura, Structure-property relationships at Nafion thin-film interfaces: Thickness effects on hydration and anisotropic ion transport, Nano Energy 46, 91-100 (2018) DOI: 10.1016/j.nanoen.2018.01.008
12. Joseph Dura, Donald Pierce, Charles Majkrzak, Nicholas Maliszewskyj, Duncan McGillivray, Mathias Loesche, Kevin O'Donovan, Mihaela Mihailescu, Ursula Perez-Salas, David Worcester, Stephen White AND/R: Advanced Neutron Diffractometer/ Reflectometer For Investigation of Thin Films and Multilayers for the Life Sciences, Rev. Sci Instr, 2006. 77 p 074301.
13. Jeanette E. Owejan, Jon P. Owejan, Steven C. DeCaluwe, and Joseph A. Dura Solid Electrolyte Interphase in Li-Ion Batteries: Evolving Structures Measured In situ by Neutron Reflectometry , Chem. Mater.24, 2012. 11: pp 2133–2140 [DOI: 10.1021/cm3006887]
14. Kienzle, P. A.; Krycka, J. A.; Patel, N. Refl1D: Interactive depth profile modeler. http://www.reflectometry.org/danse/software.
Contacts
-
(301) 975-6251