
Official websites use .gov
A .gov website belongs to an official government organization in the United States.
Secure .gov websites use HTTPS
A lock (
) or https:// means you’ve safely connected to the .gov website. Share sensitive information only on official, secure websites.
Video of Report of the Technical Investigation of The Station Nightclub Fire
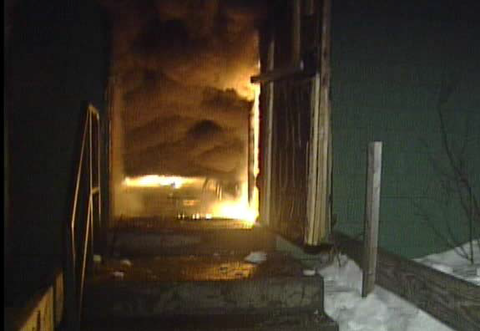
A fire occurred on the night of Feb. 20, 2003, in The Station nightclub at 211 Cowesett Avenue, West Warwick, Rhode Island. A band that was on the platform that night, during its performance, used pyrotechnics that ignited polyurethane foam insulation lining the walls and ceiling of the platform. The fire spread quickly along the walls and ceiling area over the dance floor. Smoke was visible in the exit doorways in a little more than one minute, and flames were observed breaking through a portion of the roof in less than five minutes. Egress from the nightclub, which was not equipped with sprinklers, was hampered by crowding at the main entrance to the building. One hundred people lost their lives in the fire. On Feb. 27, 2003, under the authority of the National Construction Safety Team (NCST) Act, the National Institute of Standards and Technology (NIST) established a National Construction Safety Team to determine the likely technical cause or causes of the building failure that led to the high number of casualties in that fire. This report documents the procedures, findings, and issues that were raised by the investigation.
The investigation concluded that strict adherence to 2003 model codes available at the time of the fire would go a long way to preventing similar tragedies in the future. Changes to the codes subsequent to the fire made them stronger. By making some additional changes – and state and local agencies adopting and enforcing them – we can strengthen occupant safety even further.
Non-Fire Retardant Polyurethane Foam (PUF) Burn Test (01:01) No audio.
A series of wall burns were conducted to provide insight into how the geometry impacted the growth and spread of the fire. These data assisted in the design of the mockup experiments and provided guidance for the simulation of the entire nightclub.
A second experiment used the identical 1.22 meters (4 feet) x 2.44 meters (8 feet) panels (0.025 meter thick non-fire retarded lot A polyurethane foam on 0.064 meters (0.25 inch) thick plywood backer board, supported on 2 x 4 studs), but arranged to simulate an internal corner. An internal corner leads to faster flame spread than an external corner since in the former arrangement each surface is exposed to radiant heating from the adjacent wall. In both the mock-up and the actual nightclub fire, flame spread was enhanced further by the presence of the hot layer that built up at the ceiling. The corner arrangements examined here were open to the environment at the top (no ceiling); hence, the flame spread did not continue to accelerate.
Cone calorimeter experiments were conducted on four other common finish materials similar to those in the nightclub. Two external heat fluxes were examined to account for the changing conditions experienced by the materials in the actual fire.
Comparison of Polyurethane Foams (PUFs) (01:06) No audio.
A series of full-scale experiments was conducted to document the thermal characteristics of a discharging pyrotechnic device like those that were ignited on stage in the nightclub on Feb. 20, 2003. At the beginning of the show, four separate pyrotechnic devices, or gerbs, were discharged on the platform in front of the alcove. Two gerbs, which had been positioned on the floor of the platform, discharged vertically along the centerline of the alcove opening. Two additional pyrotechnic gerbs, which were located near the other two gerbs on the platform floor, sprayed white "sparks" at a 45 degree angle to both the left and right sides of the alcove. The WPRI-TV video of the nightclub interior showed that glowing particles or "sparks" ignited the foam on both sides of the alcove in approximately 10 seconds.
The throw, or distance the hot particles traveled, the period of "spark" discharge, and the white appearance of hot particles, were consistent with a pyrotechnic device called a Silver 15 x 15 Stage Gerb. Forty silver 15 x 15 gerbs were purchased from a commercial manufacturer of stage pyrotechnics. Each gerb consisted of a cardboard tube approximately 0.022 meters (0.88 inches) in diameter and 0.15 meters (6 inches) long.
The gerbs were constructed and ignited as described in the following manner. A non-combustible material was placed inside the tube filling up the upper 0.1 meter (4 inches) of the gerb. The non-combustible material formed a solid plug near the bottom center of the tube, but provided a hollowed-out cavity for the upper part of the gerb. The hollowed out portion of plug was filled with a mixture of energetic materials and metal compounds. When the energetic materials were ignited, the non-combustible material prevented the hot material from discharging out the bottom or through the walls of the gerb. The hot gases and metallic compounds were sprayed out the upper end of the gerb. The duration of the discharge was determined by the amount of the energetic material placed in the tube. The color of the sparks was determined by the type of metal compound that was mixed in with the energetic materials. Titanium particles were added to provide a white- or silver-colored sparks. The inclusion of ferro-titanium particles would produce yellow- or gold-colored sparks.
Once the gerbs were positioned on the platform, an electrical match was inserted through the cap at the top end of the tube. An electric match consisted of a short section of resistance wire coated with a flammable chemical. When a current was passed through the wire, it heated up and ignited the coating, which in turn ignited the energetic materials in the gerb. The initial combustion generated enough gas pressure to pop the plastic cap off the end of the cardboard tube and to spray hot gases and sparks to approximately 15 feet (4.5 meters) for a period of approximately 15 seconds (hence the term 15 x 15).
For the NIST tests, each gerb or pair of gerbs was discharged either along or against a gypsum board wall. The wall had been painted black to enhance the contrast with the white sparks. A grid of 0.3 meters (1 foot) squares was painted on the wall. Gerbs were discharged in a plane parallel to the wall at an angle of either 45 degrees or 90 degrees from the horizon. Gerbs were also discharged against the wall in a plane perpendicular to the wall. Heat flux gauges and thermocouples were embedded in the gypsum wall to monitor the heat flux and gas temperatures. Electric matches were used to ignite the gerbs. Each discharge was video taped using a standard mini-DV digital video camera and an infrared camera. The infrared camera utilized a barium-strontium-titanate solid-state detector with a spectral response of 8 μm to 14 μm. The IR camera was included in these experiments to provide a qualitative image of the hot gas plume as well as the spray of the white sparks.
Non-Sprinklered Live Simulation of Stage Area (01:35) No audio.
Prior to ignition, each of the analyzers was zeroed and calibrated and the data acquisition system and videos were started to collect background data. Data for 194 channels were recorded at 1 second intervals. Ignition of the foam was initiated simultaneously with electric matches at two locations on the outer corners of the alcove, 1.66 meters above the raised floor area. The fire gases that emerged from the open door on the south end of the test room were captured in the hood of the oxygen depletion calorimeter.
Sprinklered Live Simulation of Stage Area (01:35) No audio.
This video shows how rapidly the fire spreads during the first 50 seconds, compared to how quickly the fire is controlled with sprinklers in its analogous video. The first sprinkler activates on the right of the platform 24 seconds after ignition. By 30 seconds the sprinkler above the platform on the left and the sprinkler in the alcove have activated.
(01:30) No audio.
Gypsum board covered the ceiling, floor and the remaining wall areas that were not covered with wood paneling or foam. Some of the instrumentation can be seen in the foreground of the video frame. In the image from the simulation, on the right, the comparable interior finishes can be seen. The instrumentation in the right figures is represented by colored dots. The thermocouples appear as yellow dots in evenly spaced arrays. The light gray blocks represent the locations of the heat flux sensors and the gas sampling locations, which were installed at approximately 1.5 m (5 ft) above the floor.
This compares the fire development at 10 seconds after ignition. A flame is shown on both corners where the platform wall intersects with the drummer's alcove. In the case of FDS, the area that appears to be involved with flames is based on the stoichiometric mixture fraction, where there is the ideal mixture of fuel and oxygen for a robust flame to exist. The heat release rate per unit volume represented by the simulated flames is 285.5 kW/m3. The flames in the simulation appear wider due to the grid resolution, which is 100 mm (4 in) throughout the room.
At 20 seconds after ignition, flames were growing vertically and impinging on the ceiling. The simulated flames on the right, however, have not yet reached the ceiling. As noted above, the simulated flame is constrained to grow in 100 mm (4 in) increments, both vertically and laterally. This may account for the wider flame and the accompanying redistribution of energy that would reduce the propensity for rapid vertical flame spread. Light smoke can be seen in both images along the ceiling of the alcove, with light wisps of smoke along the ceiling above the platform.
30 seconds after ignition shows an increased amount of smoke flow across the ceiling. The actual fire continues to grow at a faster rate than the simulated flames. In the video frame on the left the flames have formed twin V-patterns on each side of the alcove and the flames are spreading across the alcove ceiling. Notice the light smoke that is coming up from the carpeting below the two fire plumes. This is the result of foam melting and the burning foam droplets falling to the floor. This mode of flame spread is not accounted for within the FDS model. 40 seconds after ignition shows areas of the foam on the platform wall have burned out (note the dark area directly above the point of ignition on the left side of the alcove). The actual flame fronts have continued to spread and into the alcove, where fire is visible on portions of the side walls and the ceiling of the alcove. The flames simulated with FDS have also grown, although at a slower rate. Both of the simulated flames have impinged on the ceiling.
At 50 seconds after ignition, it appears that the entire ceiling of the alcove is burning, as well as the area of the platform wall above the opening to the alcove. There is also more smoke from drop-down of the burning foam onto the carpet, both in the alcove and on the platform. In the simulation, the flames have moved into the alcove and are spreading across the ceiling. In both images, the smoke or hot gas layer has developed across the ceiling of the enclosure.
At 60 seconds after ignition, the ceiling and the walls of the alcove have become fully involved with fire in both of the images. Flashover has already occurred in the experiment and flashover is about to occur in the simulation. In both cases, flames are extending out of the alcove across the ceiling and the smoke layer has become thicker and darker.
70 seconds after ignition shows a significant increase in the amount of the smoke in the enclosure. The smoke layer has descended to within 1.5 m (5 ft) of the floor. The flames have spread along the wall behind the platform and can be seen at the lower edge of the smoke layer in both the video frame and the image from the simulation. The smoke in the experiment appears lighter in color than it actually is due to light that is being reflected from floor level halogen lights that were used to improve the visibility for the video cameras.
The fire continues to grow in both the experiment and the simulation. The smoke layer has continued to descend. The interface height of the smoke layer is approximately 0.75 m (2.5 ft) above the floor at 80 seconds after ignition for both the experiment and the simulation. Both images also show the flame extension on the left wall of the enclosure. The upper portion of the left wall near the platform had foam installed over the paneling.
At 90 seconds after ignition, most of the visibility in the enclosure has been lost due to smoke filling. A small layer of clear area can be seen near the floor in both the experiment and the simulation. This is due to fresh air being drawn into the fire enclosure through the open doorway.
(01:30) No audio.
Another simulation of the full nightclub was completed in order to examine the effects that sprinklers may have had on the fire and the environment. The input from the FDS incident simulation was combined with the input from the FDS sprinklered full-scale mock-up simulation. Five sprinklers were placed in the simulation. One was located in the center of the alcove and the other four were placed using 3.6 m (12 ft) spacing. The west sprinklers were 1.8 m (6 ft) north and 1.8 m (6 ft) south of the alcove sprinkler and 1.8 m (6 ft) east of the platform wall. The east sprinklers were also 1.8 m (6 ft) north and 1.8 m (6 ft) south of the alcove sprinkler and 12 ft east of the west sprinklers. While the maximum allowable sprinkler spacing would have been 4.6 m (15 ft) throughout the main portion of the nightclub, the alcove would have required an individual sprinkler regardless of the sprinkler spacing used elsewhere in the nightclub. In the un-sprinklered cases, flashover of the alcove increased the rate of hazard development significantly. The single sprinkler in the alcove (which was full-scale) was shown to prevent flashover in both the sprinklered experiments and the simulations, significantly mitigating the hazard.
(02:30) No audio.
Another simulation of the full nightclub was completed in order to examine the effects that sprinklers may have had on the fire and the environment. The input from the FDS incident simulation was combined with the input from the FDS sprinklered full-scale mock-up simulation. Five sprinklers were placed in the simulation. One was located in the center of the alcove and the other four were placed using 3.6 m (12 ft) spacing. The west sprinklers were 1.8 m (6 ft) north and 1.8 m (6 ft) south of the alcove sprinkler and 1.8 m (6 ft) east of the platform wall. The east sprinklers were also 1.8 m (6 ft) north and 1.8 m (6 ft) south of the alcove sprinkler and 12 ft east of the west sprinklers. While the maximum allowable sprinkler spacing would have been 4.6 m (15 ft) throughout the main portion of the nightclub, the alcove would have required an individual sprinkler regardless of the sprinkler spacing used elsewhere in the nightclub. In the un-sprinklered cases, flashover of the alcove increased the rate of hazard development significantly. The single sprinkler in the alcove (which was full-scale) was shown to prevent flashover in both the sprinklered experiments and the simulations, significantly mitigating the hazard.
Read the official publications:
- Report of the Technical Investigation of The Station Nightclub Fire (NIST NCSTAR 2), Volume 1
- Report of the Technical Investigation of The Station Nightclub Fire: Appendices (NIST NCSTAR 2), Volume 2
- NIST Station Nightclub Fire Investigation: Physical Simulation of the Fire
- The Use of Portable Fire Extinguishers in Nightclubs: Workshop Summary
- Reconstructing the Station Nightclub Fire: Materials Testing and Small-Scale Experiments
- Reconstructing the Station Nightclub Fire: Computer Modeling of the Fire Growth and Spread