
Official websites use .gov
A .gov website belongs to an official government organization in the United States.
Secure .gov websites use HTTPS
A lock (
) or https:// means you’ve safely connected to the .gov website. Share sensitive information only on official, secure websites.
How Do You Know Your Food’s Nutrition Facts Label Is Accurate?
As you may have noticed, most of your favorite food items have recently updated their nutrition facts labels. It’s the first major update to the labels in more than 20 years. The Food and Drug Administration (FDA) announced the new label format in May of 2016, and starting this year, food and beverage manufacturers must use it on all of their products. If you look on the side of your favorite cereal box, you will probably see the new label. But how do you know that what you see on the nutrition facts label is exactly what you’re getting?
In this installment of “How Do You Measure It?,” we will help you understand how the quantities and percentages listed on nutritional facts labels are accurately determined.
Let’s start with some background. The Nutrition Labeling and Education Act (NLEA), a federal law passed in 1990, established what we know today as the nutrition facts label. Some nutrients must be listed, and others are optional. Let’s take a look at the old and new versions.
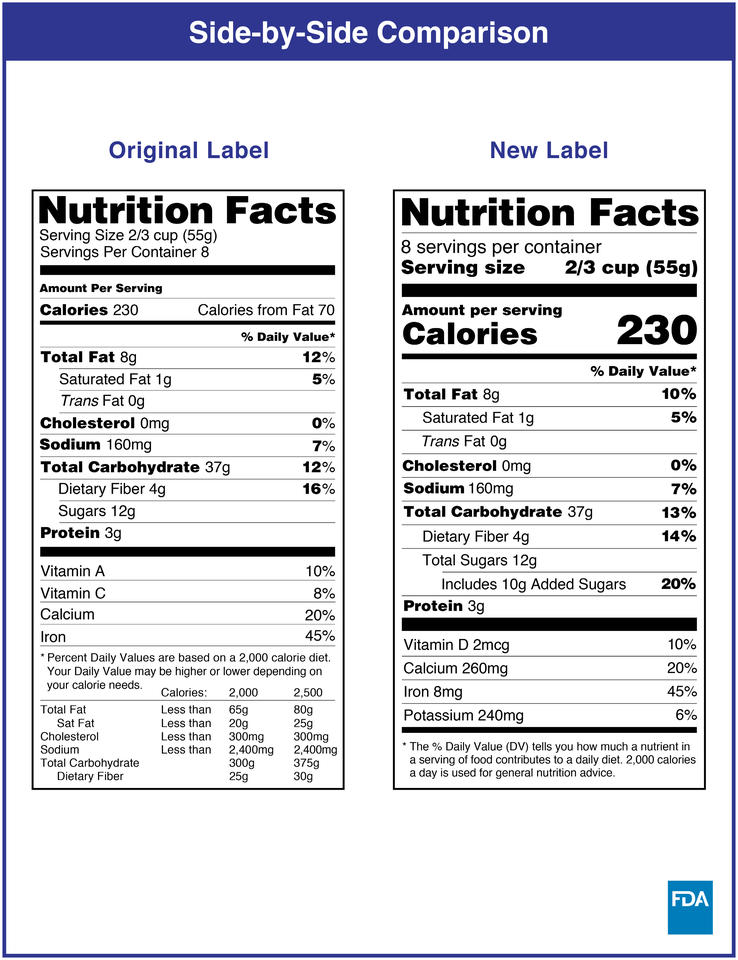
If you compare the old nutrition facts label to the new one, you’ll see differences in what is now listed, such as added sugars, vitamin D and potassium. This is because the updated nutrition facts label addresses current concerns about the vitamin deficiencies and health risks affecting the general population today.
Originally, the NLEA serving size showed the manufacturer’s recommended size. But now it shows an amount of that food that is typically consumed by one person during a single snack or meal — in many cases, a larger amount.
You can check your favorite cereal box for the changes to its nutrition facts label. But before the cereal box can make it to grocery store shelves, food manufacturers must make sure their labels meet all the required rules and regulations.
Scientists working for food manufacturers will run measurements in their labs to get numbers for the nutrients in their products. The results of those tests are reflected on their nutrition facts labels.
But how do we — and the food manufacturers themselves — know those numbers are accurate? The manufacturers compare their products to a set of reference food and beverage items whose nutrients have been carefully measured. NIST produces many of these items, known as standard reference materials (SRMs), and they run the gamut from peanut butter to fish oil.
SRMs and the Food Matrix
Manufacturers use SRMs to be more confident in their measurements, which in turn improves the accuracy of their nutrition facts labels. However, there isn’t an SRM for every food item out there.
Take spaghetti sauce. There isn’t a spaghetti sauce SRM. So, if a food manufacturer that makes spaghetti sauce wants to ensure its results are accurate, it uses something known as the “food-matrix triangle” to find the SRM that has the most similar overall components of the sauce.
The food-matrix triangle was conceived in a collaboration involving the United States Department of Agriculture (USDA) and AOAC International, an association of analytical chemists. NIST then filled different parts of the triangle with specific SRMs. The triangle represents three major food components: fat, protein and carbohydrates.
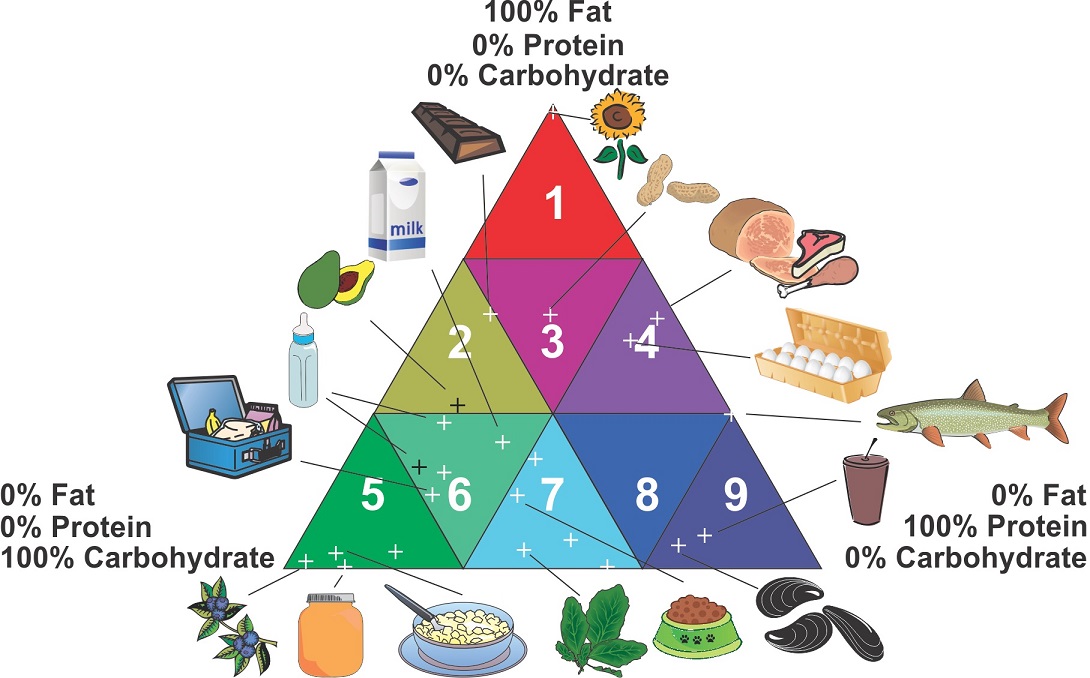
By looking at the total fat, carbohydrates and protein of the reference material, the food manufacturer can compare it against its own product. For spaghetti sauce, the reference material that comes closest in terms of its fat, carbohydrate and protein content is one of the two SRMs for infant formula.
Each SRM comes with a document that details the exact amounts of important components in the SRM. NIST researchers call this the certificate of analysis. Once the spaghetti sauce manufacturer chooses the SRM with the closest food matrix, in this case the infant formula SRM, it would use both the SRM and the certificate to make sure its measurements are accurate.
For example, suppose a food scientist working for the manufacturer wants to measure a specific nutrient, such as the amount of sodium, in its sauce. The scientist might first look at the SRM certificate, which contains instructions on how NIST measured sodium in the SRM.
The food scientist then uses the physical SRM and runs the company’s method (and sometimes the NIST method) to measure the concentration of sodium in the SRM. The scientist would then compare the measurements against the certificate to see how close they are. If the scientist’s numbers fall within the range of values suggested by the certificate, then the manufacturer knows its method for measuring the sodium in its own spaghetti sauce is accurate. But if the numbers don’t match up, then the manufacturer must go back and check its process.
You may be wondering now how accurate these standards are. It depends on the food matrix and the nutrient, but in general NIST’s measurements are accurate to within 2% to 5% for nutrient elements (such as sodium, calcium and potassium), macronutrients (fats, proteins and carbohydrates), amino acids and fatty acids. Its measurements are accurate to within 5% to 10% for water-soluble vitamins (such as vitamin C) and 10% to 15% for fat-soluble vitamins (such as vitamin D).
Some of these percentages may seem high, but they’re all consistent with industry standards and the work of experts in the field. And more than the specific nutrient values in the NIST samples themselves, the SRM and certificate serve a larger purpose: They are tools that help manufacturers test and confirm the accuracy of their own methods for measuring nutrients.
It’s also important to note that food manufacturers aren’t required to use NIST SRMs. They can use other standards and methods, but many of them use NIST’s SRMs along with the food-matrix triangle because of the high level of accuracy and efficiency they provide in validating their test methods.
Next time you visit your local grocery store, you can be more confident knowing that the nutrition facts label on the back of your cereal box — and any other food or beverage — is accurately listing the correct nutritional amounts, thanks to SRMs and the food-matrix triangle!