
Official websites use .gov
A .gov website belongs to an official government organization in the United States.
Secure .gov websites use HTTPS
A lock (
) or https:// means you’ve safely connected to the .gov website. Share sensitive information only on official, secure websites.
Single Molecule Fluorescence Measurements of Nanoscale Proton Distributions in Photoresist
Summary
The semiconductor industry's remarkable progress in making integrated circuits smaller, faster and cheaper relies on continual improvements in photolithography. This in turn relies on improvements in the optical systems that print the circuit features and in the light-sensitive polymers (photoresists) that convert the optical images into patterns on a semiconductor wafer that can then be processed to make the actual circuit elements. We are developing techniques that use measurements of the positions of single fluorescent molecules to build up a statistical picture of the chemical processes that result in the formation of the photoresist image. A detailed understanding of these processes will help ensure that photoresist materials will have the ability to reproduce the ever-smaller features that the semiconductor industry demands.
Description
Modern photoresists use a process known as chemical amplification to improve their sensitivity. Each incoming photon generates an acid molecule which then diffuses in the photoresist and catalytically causes chemical changes in the resist that result in the formation of an image. The number of catalytic events caused by a single photon can be in the hundreds or thousands – hence the term chemical amplification. This process has its drawbacks, however. The same diffusion that improves sensitivity also tends to blur the original image and limit the smallest feature size that can be printed. Understanding where the acid molecules are formed and where they subsequently diffuse is essential in optimizing the performance of photoresist.
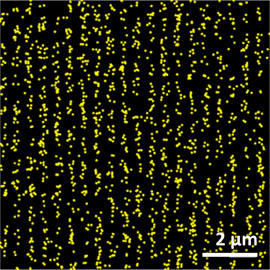
The feature sizes on a modern computer chip are on the order of a few tens of nanometers. A technique is therefore needed that is capable of mapping the distribution of acid on this kind of length scale. Fluorescence is an attractive approach because fluorescent molecules can be made sensitive to acid species. We recently tried this approach using such a fluorescing molecule developed at Korea University. Normal fluorescence imaging, however, is only able to resolve feature sizes on the order of the wavelength of light – several hundred nanometers. In order to see the feature sizes we are interested in, we use techniques originally developed in biology that image fluorescent molecules one at a time. Their positions can then be measured to within a few nanometers and, after a few thousand such measurements, a very high resolution image of the target is built up.
There is one final problem that we need to overcome: the chemistry that occurs in a photoresist can easily be affected by small levels of contamination. A measurement which depends on introducing the fluorescent chemical must not change the behavior of the photoresist. This constraint implies that we can only use very low concentrations of fluorescing molecules which will therefore be spaced far apart. The challenge, then, is to use a low concentration of fluorophores but still obtain information with nanoscale resolution. We have developed a statistical approach that makes use of the fact that, rather than imaging an arbitrary object, we are imaging a precisely structured, lithographic pattern (lines and spaces forming a grating). Forearmed with this knowledge we are able to measure the acid distribution with a precision of ± 20 nm using fluorophores with an average in-plane spacing of over 300 nm. We are now beginning to apply this method to the measurement of acid distributions in model resist systems created at the University at Albany.
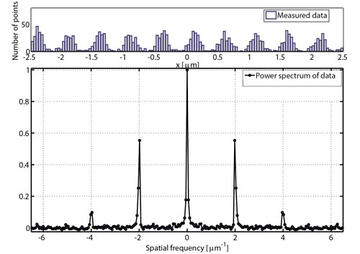
Using normal microscopy, light from individual fluorescent molecules becomes diffracted by the microscope's optics, limiting the resolution to about the wavelength of light. To overcome this limit, photoactivated localization microscopy (PALM) spreads the imaging process out in time, collecting light from only a few molecules at any given instant. In this way, the position of each molecule can be determined precisely, and a detailed image is gradually built up. As shown in the histogram of PALM data (top) along the pattern direction, collecting and merging all of the positions obtained by this imaging process over time produces spatial information with resolution better than the diffraction limit,. The observed power spectrum of the PALM data (bottom) has very well-resolved peaks at a pattern period (2 μm-1) consistent with the 500 nm pitch of the patterned lithographic lines being measured (see image at top of page).
Selected Publication:
Super-resolution optical measurement of nanoscale photoacid distribution in lithographic materials, A. J. Berro, A. J. Berglund, P. T. Carmichael, J. S. Kim, and J. A. Liddle, ACS Nano 6, 9496–9502 (2012).
NIST Publication Database Journal Web Site