
Official websites use .gov
A .gov website belongs to an official government organization in the United States.
Secure .gov websites use HTTPS
A lock (
) or https:// means you’ve safely connected to the .gov website. Share sensitive information only on official, secure websites.
Measurements and Standards for AI-Ready Biological Data: Unlocking Protein Function
Summary
The success of AlphaFold2 and similar AI models in predicting protein structure from sequence has demonstrated the transformative impact of AI in biotechnology. Inspired by that success, our goal is to tackle one of the next grand challenges at the Bio-AI interface: the Protein Function Problem, i.e., quantitative prediction of protein function from sequence.
The Protein Function Problem is a complex challenge that involves understanding how proteins interact with other molecules in their environment to perform specific tasks. With thousands of distinct protein functions, a generalized solution to this problem poses a formidable challenge, necessitating an enormous amount of high-quality data. The success of AlphaFold2 was built on protein sequence and structure data that required over four decades and $10B to accumulate. To achieve a similar breakthrough for the Protein Function Problem, but on a much shorter time frame, we must develop strategies to rapidly generate and curate high-quality datasets at relatively low cost.
Description
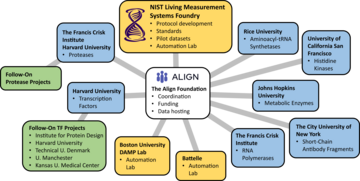
Figure 1. Overview of collaborative network. The initial collaborative scope includes development of large-scale sequence-function measurements for seven different types of protein functions. The NIST Living Measurement Systems team leads the protocol and standards development and serves as an automation laboratory for implementation of pilot datasets for each function type. The Align Foundation provides project management to coordinate across the institutions involved, funding for DNA library generation, and data hosting. For each of the seven protein function types, one or two academic labs serve as the scientific leads (blue boxes), providing deep expertise specific to each protein. To achieve the necessary scale, data is distributed across multiple automation laboratories (gold boxes). After generation of the initial, pilot dataset for each function type, the effort expands to include follow-on projects with additional collaborators (green boxes).
To address this need, the NIST Cellular Engineering Group is collaborating with the Align Foundation and several other laboratories to develop a framework of measurements and standards for AI-ready data. This framework is based on four principles designed to maximize the impact of data collection efforts toward generalized protein function prediction:
- Massive scale data: Measurements must be able to deliver quantitative data for many different protein families and functions, and for hundreds of thousands or millions of protein variants in each experiment at low cost.
- Biophysically Meaningful data: Measurements must produce meaningful data with a strong connection to the AI prediction task. For the protein function problem, datasets should ideally be reported in a biophysical representation that enables aggregation of datasets measured for many different types of functions.
- Multi-parametric data: Protein function is a complex, multi-dimensional phenomenon, so measurements must produce multi-parametric data that captures this complexity.
- High-quality data: Measurements must produce high-quality data, with each reported dataset including standardized information on the precision, accuracy, and uncertainty calibration of the data.
Growth-Based Quantitative Sequencing (GROQ-Seq) Measurement Platform
To begin the process of systematic, high-quality data generation, we have applied those four principles to create the growth-based quantitative sequencing (GROQ-Seq) measurement platform.
GROQ-Seq is a deep mutational scanning (DMS) or massively parallel reporter assay (MPRA) that connects protein functions to cell growth using synthetic biology circuits.
This approach allows us to achieve the necessary scale in three ways: First, the use of a synthetic-biology circuits approach allows us to rapidly adapt GROQ-Seq to a wide variety of different protein function types. Second, by leveraging DNA barcoding and next-generation sequencing, we implement GROQ-Seq in a massively pooled format to generate quantitative function data for hundreds of thousands of protein variants per experiment at a cost of ~$0.05 per variant. Third, we have developed GROQ-Seq using standardized, modular laboratory automation protocols on the LMSF, a cutting-edge automated biofoundry. So, we’ve been able to quickly transfer those protocols to other biofoundries and stand up multiple data generation sites.
To deliver meaningful data, suitable for aggregation across different types of functions, with each GROQ-Seq measurement, we include a set of ‘protein function ladder’ standards, which provide a reproducible benchmark and enable quantitative calibration of the datasets to a meaningful biophysical representation (rather than raw fitness or enrichment scores).
To deliver multi-parametric protein function data, we leverage the capabilities provided by automated biofoundries to run each GROQ-Seq measurement as a set of 24 parallel DMS assays. Across the set of 24 assays, we systematically vary the assay conditions to probe the multi-dimensional space relevant to each protein’s function. For example, we have used GROQ-Seq to measure the full dose-response curves of allosteric transcription factors against multiple small-molecule ligands, and to measure the DMS equivalent of enzyme saturation curves. In addition to providing a better view of the complex, multi-dimensional nature of protein functions, these multi-parametric measurements also strengthen the connection to a meaningful biophysical representation, since the relevant biophysics is inherently multidimensional.
To ensure that appropriate quality information is reported with every dataset, we are also developing methods to assess and report appropriate quality metrics for GROQ-Seq. Those include assessment of each measurement’s accuracy, precision, and dynamic range. In addition, since properly calibrated uncertainties are required for quality-based data filtering during model training, we are developing new data analysis methods to validate each dataset’s uncertainty calibration. Finally, since outlier results (i.e., something surprising, unexpected, or interesting) can be the most important data for learning sequence-function relationships, our data-quality methods will include the verification of potentially interesting outlier results (e.g., epistasis, inversion of function, change in substrate or ligand specificity).
Large-scale protein sequence-function measurements with synthetic biology and deep mutational scanning
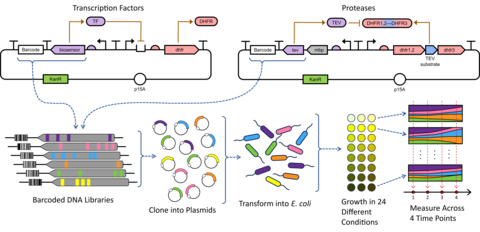
To apply the GROQ-Seq platform to a wide range of different protein function types, we have adopted a modular, synthetic-biology circuits approach. With this approach, we can rapidly design and test plasmid-borne DNA sequences that link a protein’s function to cell growth for a wide variety of different protein functions (Fig. 2). We transform a library of the resulting plasmids (with many different protein sequence variants) into bacteria cells and grow those cells in a massively pooled, DMS assay. We include DNA barcodes in each DNA design, so we can use next-generation DNA sequencing to read out the barcodes associated with each protein variant and determine its function.
Biophysically Meaningful Data
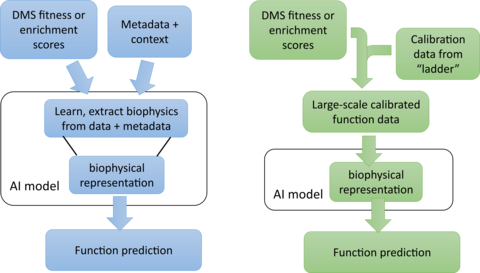
Given the huge variety of different protein functions, data aggregation to enable generalized protein function prediction poses a clear problem: how to meaningfully combine protein function datasets collected for many different types of protein functions? The current paradigm is to side-step this problem by representing diverse protein functions as a simple ‘activity’ (i.e., fitness or enrichment score), which in aggregation, can be treated similarly for all proteins. Those types of activity scores are commonly used to report the results of DMS assays. But, they have limited utility for generalized quantitative prediction. They can capture loss-of-function effects that are common across all protein types, e.g. due to protein destabilization, but this gives limited predictive power for quantitative changes in function for otherwise stable proteins. A commonly proposed strategy to overcome this limitation is to collect as much metadata as possible about each measurement and train the general AI model with both the activity-score data and the associated metadata (Fig. 3, left). However, this strategy is very inefficient, requiring much more data for a generalized AI model to simultaneously learn two things: 1) how to use the metadata to reconcile the differences between many disparate activity datasets, collected for different functions using different kinds of assays, and 2) how to use the reconciled data to predict protein function from sequence. In short, this seems like a strategy designed to maximize the amount of data and time required to solve the problem.
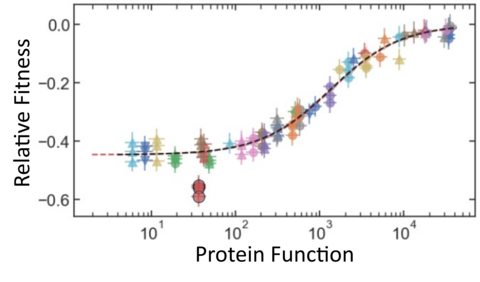
With GROQ-Seq, we are pursuing a much more efficient strategy to overcome the data aggregation problem (Fig. 3, right): We start by recognizing that any model capable of protein function prediction must use a biophysical representation of the data to make good predictions – because the underlying biophysics is what makes the problem solvable. So, in every GROQ-Seq measurement, we include a set of spike-in calibration standards to serve as a ‘protein function ladder’ – which allows us to convert the enrichment or activity scores into biophysically meaningful quantities such as reaction rate constants for enzymes or EC50 values for allosteric transcription factors. The calibration ladder consists of 10 to 20 protein variants chosen to evenly sample the full range of functional outcomes relevant for each type of protein function. We characterize the protein variants that make up each ladder using high fidelity (but lower-throughput) methods to measure the relevant biophysical quantities, and we use the results to create a calibration curve that can be applied to the entire dataset measured with GROQ-Seq (Fig. 4). This allows GROQ-Seq datasets to be reported directly in a biophysical representation that will simplify the generalized AI model prediction task, requiring much less data for good predictions across different types of proteins.
In addition to providing a calibration from low-value activity scores to higher-value biophysical quantities, the use of protein function ladders has several other advantages: Protein function ladders can be shared across multiple laboratories or used in multiple GROQ-Seq measurements in the same laboratory. So, even when the raw fitness scores are not reproducible, the GROQ-Seq datasets can be reproducibly calibrated to report biophysical quantities on the same scale. Even within a single measurement, the calibration ladders can provide valuable data-quality information such as the limiting accuracy and dynamic range of each measurement (Fig. 4).
Multi-parametric Data
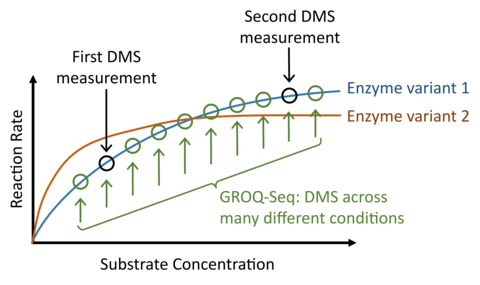
In current practice, most DMS measurements and related AI models oversimplify the protein function problem by representing protein function as a simple, one-dimensional fitness or enrichment score. But, protein function is not one-dimensional. Consider, for example, DMS of an enzyme, compared with a conventional saturation curve assay typically used to determine enzyme kinetic parameters (kcat and Km, Fig. 5): Each enzyme variant in the DMS measurement would have a different saturation curve if it were measured with the conventional assay, and a typical DMS measurement would produce a fitness score that corresponds to a single point along each curve (i.e., measurement at a single substrate concentration). However, a second DMS measurement with different conditions would then correspond to a different point along those curves. And, since mutations can affect either kcat or Km (or both), the rank-ordering of fitness scores will, in general, not be consistent across the two DMS measurements (even in the ideal case of zero measurement error). In short, quantitative characterization or prediction of protein function is not possible using a one-dimensional fitness or activity. The problem gets worse for anything beyond the simplest protein functions, e.g., functions that require switching between multiple protein states, enzymes with multiple substrates and/or cofactors, allosteric regulation, etc.
So, to produce the multi-parametric data required for a quantitative treatment of protein function, we leverage the capabilities of cutting-edge laboratory automation and implement each GROQ-Seq measurement as a set of 24 parallel DMS assays. We use the set of 24 parallel assays to explore a range of different conditions designed to probe the multi-dimensional space of relevant biophysics for each protein. For example, with enzymes, we design the 24 conditions to effectively measure the full saturation curves for hundreds of thousands of enzyme variants in each pooled GROQ-Seq measurement. In other examples, we have used the 24-sample GROQ-Seq format to measure the full dose-response curves for tens to hundreds of thousands of allosteric transcription factor variants (e.g., LacI, RamR; Fig. 6).
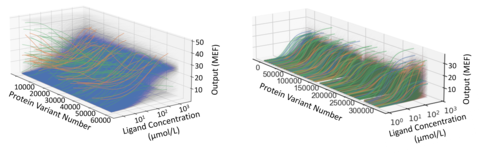
The example on the left shows 60,000 dose-response curves measured for the LacI protein, induced with its canonical ligand isopropyl β-D-1-thiogalactopyranoside (IPTG). The different colors show different types of dose-response, including wild-type-like (blue), inverted response (green), and band-stop response (orange).
The example on the right shows dose-response curves measured for 300,000 variants of the RamR protein, each induced with three different ligands. The different colors show the response to each of ligands.
Data Quality
To ensure that aggregate datasets can be used optimally for downstream model training, each dataset must include information characterizing the data quality. This will enable AI model developers to filter or weight data based on quality. So, in parallel with GROQ-Seq, we are developing a standardized framework for evaluating and reporting data quality, e.g., reproducibility, accuracy, precision, etc.
To achieve the necessary scale of data to solve the generalized protein function prediction problem will require many experiments, run at different times and at different labs, using different equipment, or even different protocols. So, as a first step, our data quality framework will include guidelines for assessing and reporting metrics related to the reproducibility of each dataset (e.g., precision, accuracy, and comparability with other datasets). The protein function calibration ladders described above provide a foundation for reproducibility, since they allow calibration of different measurements to the same scale and simultaneously provide a comparison to ‘ground truth’ needed to assess each measurement’s accuracy and dynamic range.
GROQ-Seq experiments also include internal controls that can be used to assess the measurement precision and heteroskedasticity. For example, the barcoded plasmid libraries used with GROQ-Seq typically include many internal replicates of a wild-type or starting-template protein variant: a single variant that is tagged with hundreds or thousands of different barcodes. The GROQ-Seq results for each of those wild-type barcodes can then be compared, providing an assessment of the overall measurement precision as well as important information about the heteroskedasticity of the measurement (Fig. 7).
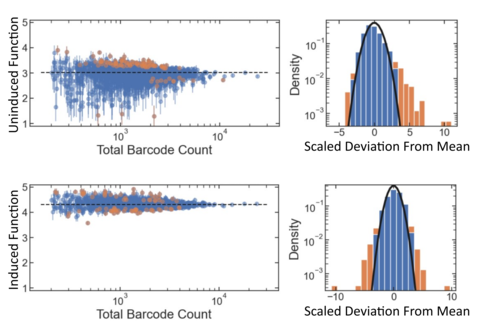
Arguably, since model developers need reliable uncertainties for optimal data filtering, the ‘accuracy’ of the reported uncertainties is more important than the accuracy of the data points themselves. So, a key aspect of our data quality framework will include methods to validate that the reported uncertainties are properly calibrated, i.e., that the probabilities implied by the stated uncertainties match the observed frequencies for the deviation between replicate data points or between the GROQ-Seq results and “ground truth.” For example, if the uncertainties are presented as Gaussian standard deviations, about 68% of the data should be within ± one standard deviation of the true value, and about 95% of the data should be within ± two standard deviations.
Another important, but often ignored, aspect of data quality has to do with outliers. In large-scale protein function datasets, there will be outliers. Some of those outliers will be real, i.e., true-positive outliers resulting from unexpected, interesting, and/or important biological effects like epistasis, changes in specificity, or inversion of function. These true-positive outliers often have the greatest value for protein engineering or for training models to predict important functional changes. But some outliers will be due to unexpectedly large measurement errors, i.e., false-positive outliers. By definition, true-positive outliers will be rare, and, with good DMS measurements, false-positive outliers will also be rare. But, even when they are rare as a fraction of the total data, false-positive outliers can occur at a rate that is similar to or even greater than true-positive outliers. False-positive outliers can thus rapidly degrade the utility of a dataset for understanding and predicting important functional effects. So, as an additional component to our data quality framework, we independently verify potentially interesting outlier results (using high-fidelity “ground-truth” measurements).