
Official websites use .gov
A .gov website belongs to an official government organization in the United States.
Secure .gov websites use HTTPS
A lock (
) or https:// means you’ve safely connected to the .gov website. Share sensitive information only on official, secure websites.
NIST has been monitoring three grid-tied photovoltaic arrays for over a year to create a database of performance data that can be used for increased understanding of system performance, model validation, and fault detection. Such understanding is important for designers, financers, and operators of photovoltaic systems to reduce the uncertainties in operation and to ultimately lower the cost and risk of these installations.
Systems:
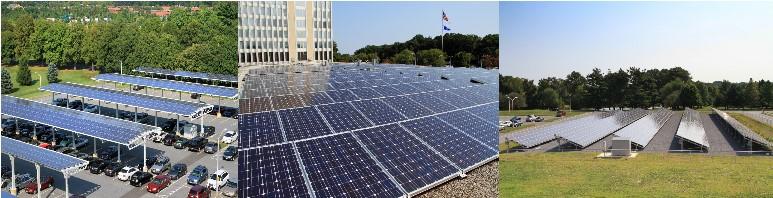
- Parking Lot Canopy Array
1032 modules with a rated DC output of 243 kW. - Ground Mount Array
1152 modules with a rated DC output of 271 kW. - Roof Tilted Array
312 modules with a rated DC output of 73.3 kW
Monitoring:
The systems have been monitored to provide data on the DC output, AC output from the inverters, temperatures of the modules, and meteorological conditions in the vicinity of the arrays at 1-second intervals. Images of the arrays are taken at 5-minute intervals to observe shading, snow and any obstructions or signs of damage. Additionally, a weather station having a more extensive suite of measurements is installed on a building on the NIST campus along with a test station to get more detailed data on representative modules' performances.
Results:
Chart of Monthly Output
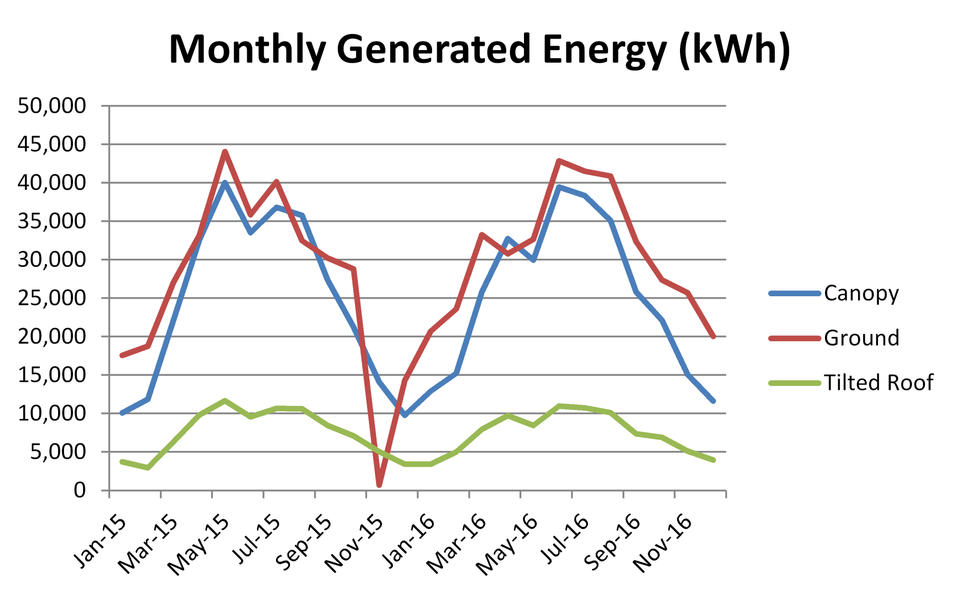
The systems produced a total of 872 MWh of electricity over the course of the first year of monitoring. This amount of energy would meet the electric needs of 80 typical US households over the course of the year. Given an average commercial electricity rate in the United States of $0.1075 per kWh in the year 2014, this electric output amounted to $93,715 without including peak demand charge reductions.
Data:
- A data portal is now publicly available at https://pvdata.nist.gov/ . The data can be interactively explored and bulk downloaded. A description of the data files can be found here, and a data dictionary can be downloaded here. Please cite as Boyd M, Chen T, Dougherty B (2017) NIST Campus Photovoltaic (PV) Arrays and Weather Station Data Sets. National Institute of Standards and Technology. U.S. Department of Commerce, Washington, D.C. [Data set]. https://doi.org/10.18434/M3S67G .
- The available data are the one-minute averaged values for 2015 and 2016 and images of the sky and arrays at 1-hour intervals. Higher frequency 1-second data and images at 5-minute intervals are available upon request; please contact william.healy [at] nist.gov (William Healy) for more information.
Publications:
- Performance Data from the NIST Photovoltaic Arrays and Weather Station
- High-Speed Monitoring of Multiple Grid-Connected Photovoltaic Array Configurations, 10/29/2015
- Evaluation and Validation of Equivalent Circuit Photovoltaic Solar Cell Performance Models, 05/01/2011