
Official websites use .gov
A .gov website belongs to an official government organization in the United States.
Secure .gov websites use HTTPS
A lock (
) or https:// means you’ve safely connected to the .gov website. Share sensitive information only on official, secure websites.
CHAL-AMB2018-01-RS
Results for CHAL-AMB2018-01-RS: Part Residual Strains Using Neutron Diffraction
1. Overview
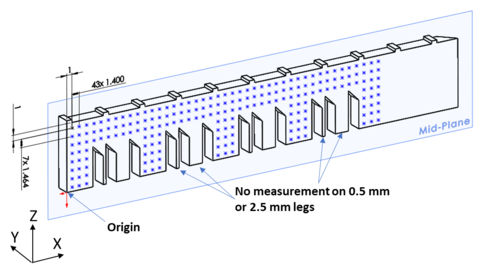
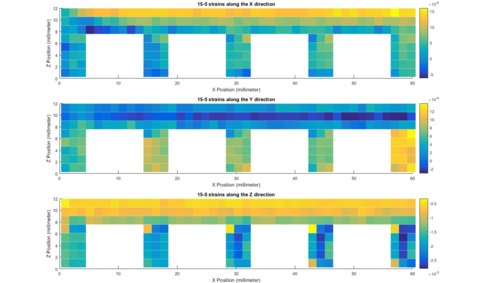
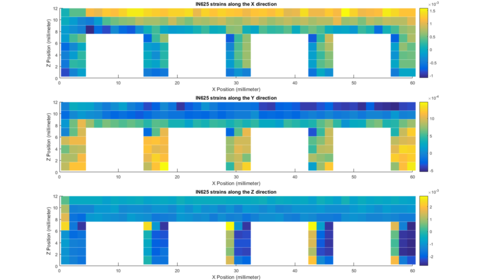
Figure 1 indicates the measurement positions for lattice strains on the X-Z plane centered on the midplane of the specimen. Strains along the X, Y, Z directions were measured using neutron diffraction at the NIST Center for Neutron Research (NCNR) using the BT8 diffractometer. Measurement gauge volume is approximately a cube with edges that measure 1.5 mm. The measurements were conducted for an IN625 specimen and a 15-5 stainless steel specimen on the commercial build machine (CBM).
2. Summary Results
Note that the measurement in the legs are not symmetric about the center of the legs in the X direction. Looking at the X-Z plane, with the Y direction into the page, the left most measurement locations in the legs are closer to the Y-Z surface. Measurement gauge volumes’ centers are 1 mm from the Y-Z surface. for the left side of the legs. Whereas the measurement gauge volumes’ centers are 1.2 mm from the Y-Z surface for the right side of the legs.
3. Data Files
The lattice strain components along the X, Y, and Z directions for each material are presented in data tables as tab-delimited text files. Each text file contains five columns, indicating the X position, Z position, ɛyy, ɛxx, and ɛzz respectively. The X and Z directions follow the convention established by Figure 1. The X and Z positions indicate the location (in millimeters) of the center of the measurement gauge volume, with the origin set at the bottom left corner of the X-Z plane. These data files and figures showing all measured strain components are available in a data publication at https://doi.org/10.18434/mds2-3052. When using these data, please follow the citation instructions on the data publication landing page.
These results are also described in a journal publication:
Phan, T.Q., Strantza, M., Hill, M.R. et al. Elastic Residual Strain and Stress Measurements and Corresponding Part Deflections of 3D Additive Manufacturing Builds of IN625 AM-Bench Artifacts Using Neutron Diffraction, Synchrotron X-Ray Diffraction, and Contour Method. Integr Mater Manuf Innov 8, 318–334 (2019). https://doi.org/10.1007/s40192-019-00149-0.
Contacts
-
(301) 975-6032
-
(301) 975-2265