
Official websites use .gov
A .gov website belongs to an official government organization in the United States.
Secure .gov websites use HTTPS
A lock (
) or https:// means you’ve safely connected to the .gov website. Share sensitive information only on official, secure websites.
AMB2018-04 Description
2018 AM-Bench Test Descriptions for AMB2018-04
Class 1 benchmark tests:
AMB2018-04: Polymers Powder Bed Fusion 3D builds. Primary focus is on shape, voids, mass, crystallinity and tensile properties.
- Overview and Basic Objectives
- Experiment Description
- Description of Benchmark Comparisons
- Data to be Provided
1. Overview and Basic Objectives
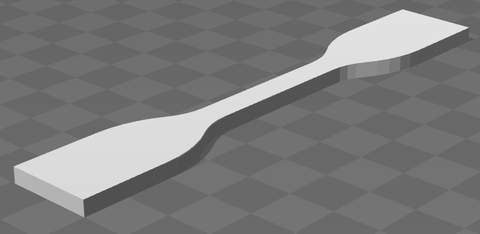
The AMB2018-04 test object consists of a dogbone shaped part produced by Powder Bed Fusion (sometimes referred to as Selective Laser Sintering) made from a polyamide. The precursor material is PA12 powder (sometimes referred to as Nylon 12 powder). The primary objectives of AMB2018-04 tests are to predict the primary macroscopic aspects of the print (thickness, mass), the microscopic shape (voids) the tensile properties and the crystallinity of the printed part

We emphasize that modelers who wish to submit simulation results are free to address any number of challenges. Modelers are also free to simulate any other aspects of the build that they want, and additional validating data will be made available.
All data, including precursor material characterization, scan strategy, part CAD files, and example measurement results data can be found using the links at the end of this document.
2. Experiment Description
2.1 Materials and Part Design
2.1.1 Build chamber: Parts will be built on a ProX500 SLS machine manufactured by 3D Systems corporation. The build chamber measures 381 mm wide, 330 mm front to back, and a maximum depth of 457 mm. Heat is provided by a six-zone PID-controlled array of eight (8) infrared heating lamps above the build chamber, as well as the heated piston and cylinder supporting the build plate. PA12 powder is applied in 0.1 mm thick layers via a compressive counter-rotating roller. The entire build is conducted in a nitrogen gas environment.
2.1.2 Part geometry: Figure 2 presents a schematic of the part. A stereolithography (STL) file named “Tensile_Bar SLS.stl” for the individual part can be found here.
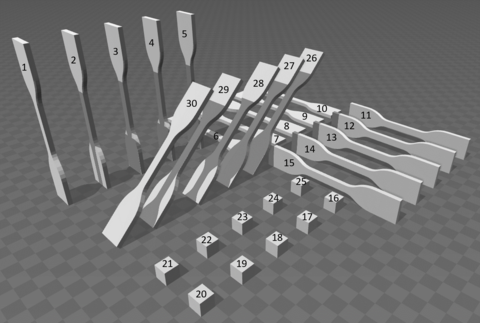
2.1.3 Part layout in the build chamber: Parts are fabricated in the order they are labeled (Part 1 first, Part 4 last). A STL file of the build chamber layout named “Part Bed Layout SLS” can be found here.
2.1.4 Feedstock Material: Duraform ProX PA12 powder was obtained from 3D Systems. The powder was preheated in the feed hopper at 110°C for 1-2 hours during application of a 13 mm base layer, before printing commenced. Certifications for the materials is available from the manufacturer here. The following tests were conducted on the feedstock material:
|
Material State |
Test (links not yet available) |
|
Powder |
Powder size and shape |
|
Powder |
Molar Mass and Distribution |
|
Powder |
Composition |
|
Powder |
Thermal Degradation |
|
Powder |
Thermal properties of crystallization and melting |
|
Powder |
Crystallinity x-ray diffraction |
|
Mold (from powder) |
Glass transition |
|
Mold (from powder) |
Viscoelasticity |
|
Mold (from powder) |
Tensile Properties |
2.2 Scan Strategy and Parameters
The following presents the print strategy and parameters used in the prints by the instrument.
|
Powder Bed Fusion Manufacturer |
3D Systems |
|
Model |
ProX 500 |
|
Institution conducting the prints |
US Army Research Laboratory |
|
Laser wavelength |
9.4 – 10.6 μm |
|
laser power |
100W |
|
Laser spotsize |
200 μm |
|
Wall Temperature setpoint |
155°C |
|
Bed Temperature setpoint |
169°C |
|
Print Direction |
Alternating x-y |
|
Layer Height |
100 μm |
|
Raster width |
200 μm |
|
Laser velocity |
12 m/s |
|
Powder roller type |
Compressive counter rotating |
3. Description of Benchmark Comparisons
3.1 Part Thickness: Benchmark Challenge (CHAL-AMB2018-04-Th): Predict the thickness of the thinnest dimension of the part after it is broken out of the part bed. Measurements to be made by simple calipers method on three locations along the gauge.
3.2 Part Mass: Benchmark Challenge (CHAL-AMB2018-04-Ma): Predict the mass of the coupon after it is broken out of the part bed.
3.3 Part Tensile Properties (CHAL-AMB2018-04-TP): Predict the tensile properties of the part after it is broken out of the part bed, including Young’s modulus, ultimate strain, and ultimate strength. Predict the location of the failure point. Predict the mode of failure. More detail needed.
3.4 Part Void Distribution (CHAL-AMB2018-04-VD): Predict the shape and size distribution of voids part after it is broken out of the part bed. Predictions can be compared to voids that are imaged via 3D X-ray CT system. The imaging system is a Zeiss Versa XRM500 is a 30-160 kV, 2-10 W instrument. It has four optical lenses, 0.4x, 4x, 20x, and 40x, which can be used to adjust the geometric magnification at a given source-sample-detector positions. The instrument can give reconstructed voxel sizes between 0.5 micrometers to 30 micrometers. Scanning of the gauge section will be carried out at a resolution of 6 micron.
3.5 Part Cross Section (CHAL-AMB2018-04-CS): Predict the shape and size distribution of voids within the part after it is broken out of the part bed by comparison with cross-sectional image. Measurements to be made by polarizing optical microscopy of cross sections along the x-y direction of the gauge.
3.6 Crystallinity and Melting (CHAL-AMB2018-04-CM): Predict the melt onset temperature, the melt peak temperature, the enthalpy and the crystallinity of a piece of the coupon. See section 3.6 of the file “AMB2018-04-Test Descriptions” for details. A 2 mm cube will be sectioned from the interior of the grip sections (widest part) of the dogbone and tested using a TA Instruments Discover series DSC at a heating rate of 10°C / minute. Enthalpy will be calculated by integrating the melting peak, and crystallinity will be assessed by comparing to the theoretical melting enthalpy of a pure PA12 crystal.
4. Description and Links to Associated Data
The following data will be provided to assist in the development of models and simulations. Benchmark measurement results data will be provided on May 19th. Each link directs the user to a downloadable zip folder, which contains the data briefly described below, as well as a document with thorough description of the zip folder contents, file structures, and information pertaining to how the data or measurements were generated or obtained.
The following data files are available to facilitate model development:
Links to STL files will be here.
Links from table 2.1.4 swill be supplied here. (Links not yet available)
Disclaimer
The National Institute of Standards and Technology (NIST) uses its best efforts to deliver a high-quality copy of the Database and to verify that the data contained therein have been selected on the basis of sound scientific judgment. However, NIST makes no warranties to that effect, and NIST shall not be liable for any damage that may result from errors or omissions in the Database.
Any mention of commercial products within NIST web pages is for information only; it does not imply recommendation or endorsement by NIST.
Contacts
-
(301) 975-4876
-
(301) 975-2836