Official websites use .gov
A .gov website belongs to an official government organization in the United States.
Secure .gov websites use HTTPS
A lock (
) or https:// means you’ve safely connected to the .gov website. Share sensitive information only on official, secure websites.
Summary
Moiré quantum matter (MQM) systems consist of stacked and twisted layers of van der Waals materials and have emerged as versatile condensed-matter quantum simulators. The twist angle, choice of material, number of layers, and application of electric and magnetic fields provide a vast playground for realizing quantum phases resulting from the interplay between electron correlations and topology. The discovery of flat electronic bands hosting superconductivity and correlated insulating states in magic-angle twisted bilayer graphene (MATBG) inspired rapid exploration of the parameter space. In this project, we are engineering flat electronic band systems involving graphene heterostructured devices as a platform for condensed-matter quantum simulators. In many cases, the Berry curvature of the electronic bands plays a central role in the physics of the system, which we are studying with Landau level spectroscopy using scanning tunneling microscopy measurements coupled with theoretical computations, as well as combined with electrical transport measurements and atomic force measurements.
Description
Twisted double bilayer graphene
The moiré systems of magic angle twisted bilayer graphene (MATBG) and related heterostructures support topological bands with nonzero Chern number, which is derived from the Berry curvature of the Bloch wave functions. Berry curvature is intimately related to orbital magnetization, and indeed, previous work on MATBG and related systems has observed orbital magnetic order, valley Hall and quantum anomalous Hall effects. Berry curvature and the related quantum metric also provide significant contributions to the orbital magnetic susceptibility. The valley-contrasting orbital magnetism and orbital magnetic susceptibility play a central role in the material response to applied magnetic fields. Landau level spectroscopy is a well-established tool to experimentally deduce the zero-field properties of the band structure, and in this work, we expand its application to extracting higher-order magnetic response functions in the application to twisted double bilayer graphene (TDBG).
Figure 1A shows the simulated band structure of TDBG at θ = 1.75° using the Bistritzer–MacDonald (BM) continuum model. The moiré periodic potential leads to narrow moiré mini-bands, composed of two low-energy bands—the valence V1 and conduction C1 bands—and higher remote energy bands—V2 and C2. The narrow bands V1 and C1 have a bandwidth of about 50 meV and are isolated from other bands (Fig. 1B). The TDBG system displays a large tunability in its electronic structure. A perpendicular electric field induces a potential difference between the layers of TDBG, drastically altering the V1 band structure. The V1 band is relatively flat at zero displacement field (Fig. 1B) and develops pronounced electron and hole pockets at D ≠ 0 (see Fig. 1C and fig. S8).
Figure 1E shows the experimental LDOS map of the differential tunneling conductance as a function of sample bias, 𝑉B, the displacement field D, carrier density 𝑛, and magnetic field, 𝐵 at 𝐵 = 0 T. The low-energy bands V1 and C1 and remote bands V2 and C2 and their evolution with displacement field are clearly visible. The experimental data qualitatively agree with the modeled LDOS of the top layer of the four-layer graphene system using continuum model calculations (Fig. 1F).
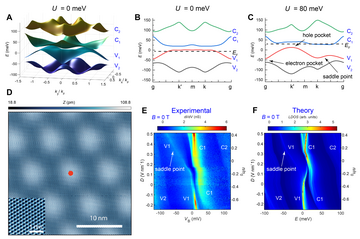
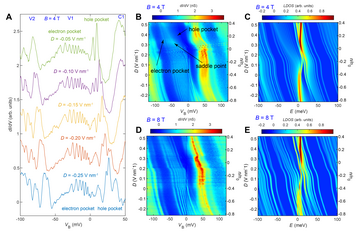
Application of a magnetic field creates sharp LLs in the dI/dV spectrum of all four bands, as shown in the dI/dV maps at 𝐵 = 4 T and 8 T in Fig. 2, B and D. All dI/dV maps with magnetic field are acquired on an ABBC site (see red dot in Fig. 1D). The experimental maps can be compared to the theoretical maps in Fig. 2, C and E, obtained from magnetic field-dependent quantum mechanical calculations, following the methods in. A series of LL spectra at different displacement fields are extracted from the experimental map at 𝐵 = 4 T (Fig. 2A). The LLs in the V1 band are clearly pronounced and show that the LL energies are irregularly spaced, exhibiting neither the equal spacing characteristic for a parabolic band nor the square root dependence on orbital index as observed in graphene.
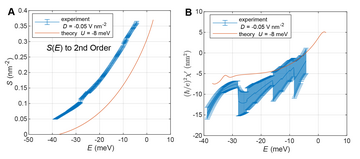
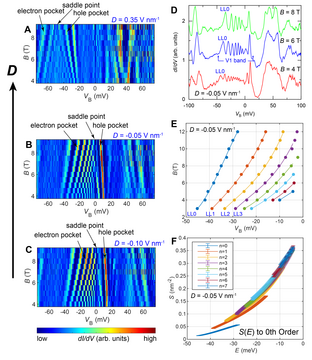
A close examination of the LLs in Fig. 2 shows a breakdown of the Onsager relation. To see this, we zoom in on the LLs in the V1 band. Figure 3D shows extracted, well-resolved spectra at selected 𝐵-fields. In Fig. 3E we display the corresponding peak positions of the LLs in the V1 band vs. 𝐵 for 𝑛 = 0 … 8, showing how the Landau levels disperse with magnetic field. Landau levels are semiclassically described by Onsager’s quantization condition, which requires that the total phase accumulation over a cyclotron orbit be an integer multiple of 2𝜋. This yields 𝑆(𝐸𝑛)𝜙02𝜋 = 2𝜋𝐵𝑛(𝑛 + 1/2), relating the 𝑘-space area 𝑆(𝐸𝑛) of the zero-field iso-energy contour of the 𝑛th Landau level 𝐸𝑛 to the magnetic field 𝐵𝑛, where 𝜙0 = ℎ/𝑒 is the magnetic flux quantum, ℎ is Planck’s constant and 𝑒 is the elementary charge. With the equal energy 𝑘-space area scaling as 𝐵𝑛(𝑛+1/2) for all LLs at energy 𝐸𝑛, a plot of 𝑆 ∝{𝐵𝑛(𝑛+1/2)}𝑛=0,1,2,… versus LL energy for all LLs would collapse onto a single curve. From Fig. 3E, we plot 𝑆 ∝ {𝐵𝑛(𝑛+1/2)}𝑛=0…7 in Fig. 3F. The fact that experimental data points fail to collapse onto a single curve demonstrates the inadequacy of the Onsager relation and the need for higher-order corrections.
A further analysis of the LL energies allows the orbital area and derivative of the magnetic susceptibility to be obtained to second order as shown in Fig. 4.