
Official websites use .gov
A .gov website belongs to an official government organization in the United States.
Secure .gov websites use HTTPS
A lock (
) or https:// means you’ve safely connected to the .gov website. Share sensitive information only on official, secure websites.
February 1,2015 to January, 31 2016 Energy Performance NZERTF Energy Performance
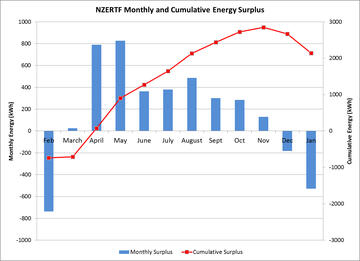
The above plot shows if the NZERTF was an exporter or importer of energy on a monthly basis. Exports occur when the electrical energy produced by the solar photovoltaic array exceeds the energy consumed by the NZERTF. Imports occur when the energy consumed by the NZERTF exceeds the energy produced by the solar photovoltaic array. The red line represents the cumulative electrical export. It is the sum of the energy exported minus the sum of the imported electrical energy over the entire time period depicted on the graph. Since the beginning of data collection (February 1, 2015) the house has produced 2139 kWh more energy than it has consumed while meeting all the needs of a typical family of four.