
Official websites use .gov
A .gov website belongs to an official government organization in the United States.
Secure .gov websites use HTTPS
A lock (
) or https:// means you’ve safely connected to the .gov website. Share sensitive information only on official, secure websites.
Energy Spectrum of Ultracold Atoms in a Synthetic Magnetic Field
Summary:
Among the driving forces behind studying ultracold atoms is the exquisite control and flexibility available in experiments. This flexibility enables us to engineer new states of matter, e.g. cold atom emulators of other physical systems which are not presently accessible to experiment.
When an electron moves around in a two-dimensional crystal lattice, turning on a magnetic field makes the electron's energies generate a special kind of fractal known as the Hofstadter butterfly -- one of the first fractals discovered in physics.
With cold atoms, one can not only mimic this system but also manipulate it in exotic ways that might be difficult or impossible to do for a real electron. In 2005, scientists in Europe engineered a laser configuration where the cold atoms precisely mimicked the physics of these electrons--and then extended it so that instead of a real magnetic field, the lasers created an exotic artificial magnetic field known as a non-Abelian gauge field. The scientists wittily named the energy spectrum the "Hofstadter moth." In this work, we went one step further and removed the crystal lattice, generating a slightly different species of Hofstadter's moth, which we see in the image here.
Scientific visualizations can make physical phenomena easier to understand--in particular, in quantum mechanics, where almost nothing can be easily seen. These data are complicated three-dimensional energy surfaces, and are difficult to interpret. Using visualization, certain features of the data jump out--for example, that the "moth" has a "backbone" where the energy surfaces all collapse, indicating that for certain laser configurations, the artificial magnetic field is not non-Abelian.
Additional Technical Details:
The data contains three independent variables, α1, α2, and ky. For each triple, there are six dependent variables, representing energy:
α1, α2, ky, Z1, Z2, Z3, Z5, Z5, Z6
There are 50 values each for α1, α2, and ky and they form a regular 3D grid. However there is symmetry about zero for ky, so we only needed to use the first 25 values.
For the visualization, α1 and α2 are represented as X and Y. ky is represented by color using a linear color ramp where the lowest value, zero, is blue, the middle value, 2.0 is green and the highest value, 4.0 is red. The six dependent variables are plotted in the Z direction.
Each line of the file was broken into six lines of triples and a column number was added to the end of each line as a comment, to indicate which of the 6 Z values that point came from :
X, Y, Z1, #Z1
X, Y, Z2, #Z2
X, Y, Z3, #Z3
X, Y, Z4, #Z4
X, Y, Z5, #Z5
X, Y, Z6, #Z6
These triples were plotted XYZ locations and assigned an RGB color based on the value of ky. It was immediately clear all the points X Y Z1, for each value of X and Y lay in a surface. Likewise, for each of Z2..Z6, so for each value of ky, there are a total of six surfaces convoluted in the Z direction. There is a usa-button on the user interface to individually turn on or off the points for each value of ky.
The next step was to add some structure to show this relationship. The easiest way to visualize this was to build a grid on each surface. A script generated lines for each point on the same surface (using the column number added) for a given X or Y value. If the specified value did not exist in the file, no line was generated. This enforces a rule that all grid lines are composed of actual data points, therefore there are no interpolation artifacts.
Grid files consisting of evenly spaced lines such that the surfaces were divided into ten row and columns were generated. Also generated were separate files with X and Y lines at the min and max vales, thereby framing each surface.Again, there are usa-buttons to turn on or off the grid lines or sides for each value of ky.
Finally, a fatpoints shader was used to generate pseudo- spheres at each point that are a constant (but user adjustable) size with respect to the virtual coordinates. Normally points occupy a constant number of pixels on the display so the visual density of a point set gets lower as the view point gets closer. The fatpoints generate billboards that are shaded to convincingly appear as spheres. Since this is done on the GPU, there is no use of CPU resources. If the size is set to zero, the fatpoints shader is turned off, and the non-fatpoints are generated.
Using these features, the scientists can easily visualize and highlight different relationships between the data points.
Return to Visualization
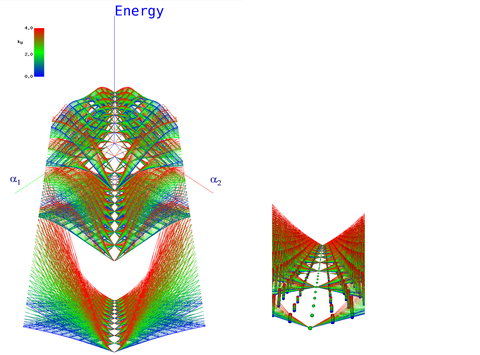
Visualization of the Energy Spectrum of Ultracold Atoms in a Synthetic Magnetic Field. The figure on the left shows the spectrum of energy levels of a cold atom in a laser configuration designed to make the atom mimic an electron confined in two dimensions, in a generalization of a magnetic field called a "non-Abelian gauge field." The atom's energy levels are functions of three parameters: α1 and α2 are related to the strengths of the artificial magnetic field, and kyrepresents the atom's momentum. Along the line (α1 = α2), the field reduces to the usual (Abelian) magnetic field. This type of figure is sometimes called a "Osterloh moth," after the "Hofstader butterfly" structure that was identified by Douglas Hofstadter in the Abelian system. The figure on the right shows a close up of the line (α1 = α2).
Additional Project Information:
-
K. Osterloh, M. Baig, L. Santos, P. Zoller, and M. Lewenstein, Cold Atoms in Non-Abelian Gauge Potentials: From the Hofstadter "Moth" to Lattice Gauge Theory, Physical Review Letters, 95(1), 010403, 2005.
-
I. I. Satija, D. C. Dakin, J. Y. Vaishnav and C. W. Clark, Physics of a Two-Dimensional Electron Gas with Cold Atoms in Non-Abelian Gauge Potentials, Physical Review A, 77(4), 043410, 2008.
Staff:
- Collaborating Scientist: Charles Clark
- Collaborating Scientist: Jay Vaishnav
- Visualization: Terence J. Griffin
- Visualization: Marc Olano
- Visualization: Judith E. Terrill
- Group Leader: Judith E. Terrill