U.S. flag

An official website of the United States government

Official websites use .gov
A .gov website belongs to an official government organization in the United States.

Secure .gov websites use HTTPS
A lock ( ) or https:// means you’ve safely connected to the .gov website. Share sensitive information only on official, secure websites.

Thermal Comfort Studies

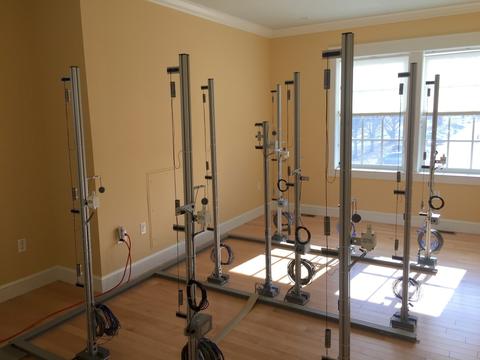
To assess the impact of different heating, cooling, and ventilating equipment on thermal comfort, the research

Thermal comfort measurement setup
Figure 1.  Thermal comfort measurement setup.
team instrumented a bedroom with a 3x3x3 array of sensors as shown in Figure 1 that provides an indication of how humans would respond to ambient conditions.  Thermal comfort is generally thought to be captured by measurements of four quantities:  dry-bulb temperature, relative humidity, air speed, and radiant temperature.  Dry-bulb temperature is measured at 27 locations; relative humidity and radiant temperature are measured at 6 locations; airflow is measured at 4 locations.  Two separate heat pump units were implemented during this test.  The first, a conventional air-source heat pump, uses typical metal ductwork that would be installed in the majority of homes in the United States.  The second system is termed a small-duct, high-velocity system.  This heat pump uses small diameter flexible ducts, with a blower that allows for air to be injected into rooms at higher speeds.  These systems are alternated on a weekly basis.  Additionally, a mechanical ventilation system provides outdoor air to the bedroom in accordance with ASHRAE 62.2-2010.  The ventilation system is controlled on an intermittent basis, with air being introduced for 43 minutes of each hour. 


To observe how the temperatures vary throughout the day and when different equipment is being used, contour plots are developed at different times and at different heights in the room as demonstrated below in Figure 2.  Additionally, plots of various quantities, such as the Predicted Percentage of Dissatisfied (PPD) occupants, are made over the course of each day.  

Figure 2.  Contour plots of temperature at different times during the day and at different heights.
Figure 2.  Contour plots of temperature at different times during the day and at different heights. 

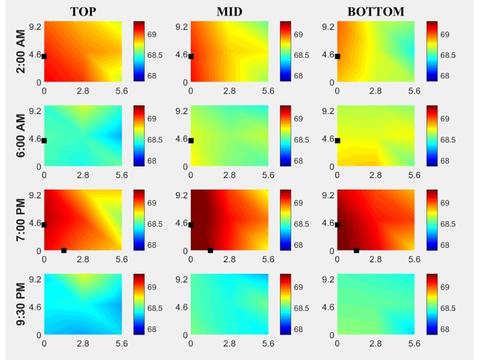
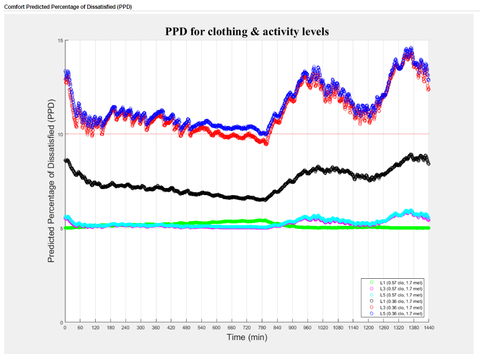
Figure 3 shows the PPD for 2 different clothing levels and two different activity levels for three locations in the room. For this winter day, it would be expected that occupants would be wearing a higher level of clothing (i.e., a higher “clo” value), with the corresponding PPD being shown in the bottom three curves.   This plot shows that the measured conditions in the room are predicted to be perceived as uncomfortable by approximately 5 % of the population throughout the day, a value that is considered good for thermal comfort assessment.  

Figure 3.  Predicted Percentage of Dissatisfied Occupants for a winter day; 6 plots correspond to 2 different clothing levels and 2 different levels of activity for three locations in the room.  The three plots on the bottom involve the clothing level tha
Figure 3.  Predicted Percentage of Dissatisfied Occupants for a winter day; 6 plots correspond to 2 different clothing levels and 2 different levels of activity for three locations in the room.  The three plots on the bottom involve the clothing level that would be expected in winter (i.e., a higher “clo” value), indicating a low level of predicted dissatisfaction.

The team continues to assess how different equipment impacts thermal comfort and will soon publish the results of the study. 

Contacts

Created February 22, 2017, Updated November 15, 2019