Official websites use .gov
A .gov website belongs to an official government organization in the United States.
Secure .gov websites use HTTPS
A lock (
) or https:// means you’ve safely connected to the .gov website. Share sensitive information only on official, secure websites.
Datasets
Datasets
These datasets are provided for public, open use to enable broader development of data processing or analyses. NIST does not endorse or support conclusions made by outside organizations based on their analyses or use of these datasets but encourage researchers to contact the respective dataset authors with questions or collaboration.
Measurement tools, analyses, or data formats may change from dataset to dataset as methods improve, therefor it is not recommended to assume the conditions of one dataset apply to the other. If using this data, please cite the data DOI from the NIST Publica Data Repository (PDR) given on each dataset’s PDR landing page. Please also cite the associated data description articles in the Journal of Research NIST, if available.
The following open source utilities are recommended for file viewing:
- Decompression of large *.zip files should use the free utility 7-zip.
- Audio-video interleave (AVI) files viewed with the free utility VirtualDub.
- Some AVI files may be compressed using the Lagarith Lossless Codec.
- Image files and TIFF stacks may be viewed using ImageJ or Fiji.
- HDF5 file structure and metadata may be viewed using HDFView.
Process monitoring datasets are provided listed below in chronological order and provide additional improvements with each new dataset. However, it is recommended that users review description articles and literature for earlier datasets.
Process Monitoring Datasets
“Three-Dimensional Scan Strategies” – Process Monitoring Data
- Data description article: https://doi.org/10.6028/jres.124.033
- Data DOI and download: https://doi.org/10.18434/M32044
- Summary: Ten rectangular IN625 parts with replicated geometry, but a variety of different scan strategies. Melt pool monitoring was conducted at 2 kHz and applied to a different part in each layer. Layer imaging acquired one image before, and one image after recoating.
- Example use cases: Yeung et al. 2020, Yang et al. 2020, Lu et al. 2020, Yang et al. 2019,
“Overhang Part X4” – Process Monitoring Data
- Data description: https://doi.org/10.6028/jres.125.027
- Data DOI and download: https://doi.org/10.18434/M32233
- Summary: Four nominally identical IN625 parts built in the AMMT, where material, scan strategy, and laser processing parameters were replicated. Parts include a simple horizontal cylindrical cutout and overhang feature. Melt pool monitoring was conducted at 10 kHz, and layer imaging uses three different illumination angles, resulting in size images per layer.
- Example use cases: Zhang et al. 2023; Lane et al. 2022;
“Overhang Part X16” – Process Monitoring Data
- Data description: https://data.nist.gov/od/ds/ark:/88434/mds2-2309/OverhangX16_In-situData_UserNotes.pdf
- Data DOI and download: https://doi.org/10.18434/mds2-2309
- Summary: Similar to OverhangPartX4, but with 16 replicant parts with replicant build parameters.
- Note: Users should refer to “Overhang Part X4” data description. Additional user notes are provided in PDF as part of dataset.
- Example use cases: …
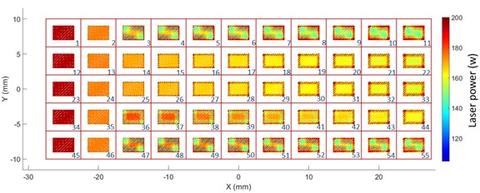
“RHF” – Process Monitoring Data
- Data description: https://data.nist.gov/od/ds/ark:/88434/mds2-2507/HY-RHF-DataDescription.pdf
- Data DOI and download: https://doi.org/10.18434/mds2-2507
- Summary: Laser scans on bare metal In625 plate consisting of 2 mm x 3 mm patches with varying power and velocity profiles.
- Note: The dataset includes visible-light microscopy of the laser-scanned surfaces.
- Example use cases: Yeung et al. 2020;. Carraturo et al. 2020; Zhang et al. 2022;
AM Bench 2022 – Thermography of Single Tracks and Pads (AMB2022-03)
- Data description: https://data.nist.gov/od/ds/mds2-2716/2716_README.txt
- Data DOI and download: https://doi.org/10.18434/mds2-2716
- Summary: Thermography data pertaining to individual laser tracks on bare metal plates of IN718 with different laser power, speed, and diameter settings. Also, arrays of adjacent laser tracks (pads) on bare metal plates of IN718.
- Note: Detailed descriptions are found here. Refer to the AM-Bench web page for accessing additional ex-situ characterization data for these experiments. Users may be most interested in ex-situ characterization of track and pad melt pool cross-sectional geometry found here.
- Example use cases: …

Ex-situ Part Characterization Datasets
“Overhang Part X4” – X-ray CT Data
- Data description: https://doi.org/10.6028/jres.125.031
- Data DOI and download: https://doi.org/10.18434/mds2-2291
- Summary: XCT image slice data and files generated from post-build X-ray computed tomography (XCT) measurements of the four parts built as part of the “Overhang Part X4” in-situ monitoring dataset.
- Example use cases: …

“Overhang Part X16” – X-ray CT Data
- Data description article: https://doi.org/10.6028/jres.125.031 (Same measurement system as OverhangX4)
- Data DOI and download: https://doi.org/10.18434/mds2-2309
- Summary: XCT image slice data and files generated from post-build X-ray computed tomography (XCT) measurements of the sixteen parts built as part of the “Overhang Part X16” in-situ monitoring dataset.
- Example use cases: …