
Official websites use .gov
A .gov website belongs to an official government organization in the United States.
Secure .gov websites use HTTPS
A lock (
) or https:// means you’ve safely connected to the .gov website. Share sensitive information only on official, secure websites.
Taking Measure
Just a Standard Blog
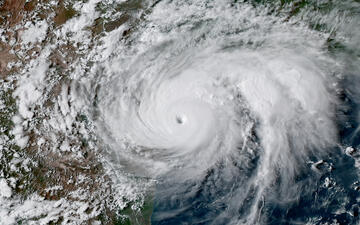
Hurricane Harvey, seen here from the NOAA GOES-16 satellite on August 25, 2017, was the first Category 4 hurricane to make landfall along the Texas Coast since Carla in 1961. An average Atlantic hurricane season produces 12 named tropical storms, six of which become hurricanes and two of which become major hurricanes.
The Atlantic hurricane season is now upon us, and the National Oceanic and Atmospheric Administration (NOAA) has just released its 2018 seasonal hurricane outlook, which calls for a slightly above average season. The potential range of activity indicates that we could expect 10 to 16 named storms with five to nine becoming hurricanes and one to four becoming major hurricanes. But remember, it only takes one bad storm to wreak havoc, or in the case of the 2017 hurricane season, three!
Wait a minute! Why am I reading about hurricanes and NOAA on a NIST blog? Let’s back up for a moment and start at the beginning.
It’s September 27, 1985, and I’m riding a skateboard in a hurricane! That’s right, I was out there in my Jams shorts and Vans sneakers on my concave skateboard taking full advantage of the awesome power of the wind as it propelled me down the street while the center of Hurricane Gloria violently spun just off the coast of New Jersey.
It’s hard to pinpoint the exact moment that I knew I wanted to study meteorology (not metrology! I’ll get to measurements later), but it was somewhere close to the juxtaposition of an amazing middle school earth science teacher, riding a skateboard in a hurricane, and the incredible awe and beauty of the hurricanes traversing the Atlantic in the satellite imagery on display from the newly minted 24-hour per day Weather Channel.
And so began a lifelong passion and journey of discovery that has led me to the National Institute of Standards and Technology (NIST) as director of the National Windstorm Impact Reduction Program (NWIRP).
Better known for its atomic clocks and computer security standards, NIST may seem like an unconventional place to lead an effort that, on its surface, may appear to be just another weather program. I mean, come on, windstorms are just weather, right?
Well, sort of.
NWIRP is a collaborative interagency program focused on achieving measurable reductions in windstorm impacts. While there are synergies with other federal weather-related programs, the NWIRP program aims to leverage and build on the wonderful scientific foundation developed by the entire weather-interested community, from farmers and TV meteorologists to emergency managers and weather and climate scientists. Its goal is to create an end-to-end understanding of windstorm-related natural hazards and develop actionable information on how these hazards directly impact communities. We then disseminate that information to strengthen windstorm impact reduction efforts nationwide.
For instance, by determining the wind speed and measuring its effects, we can make recommendations about what building materials to use, propose building design and code changes, and develop strategies for mitigating the impact of windstorms on utilities and rescue efforts.
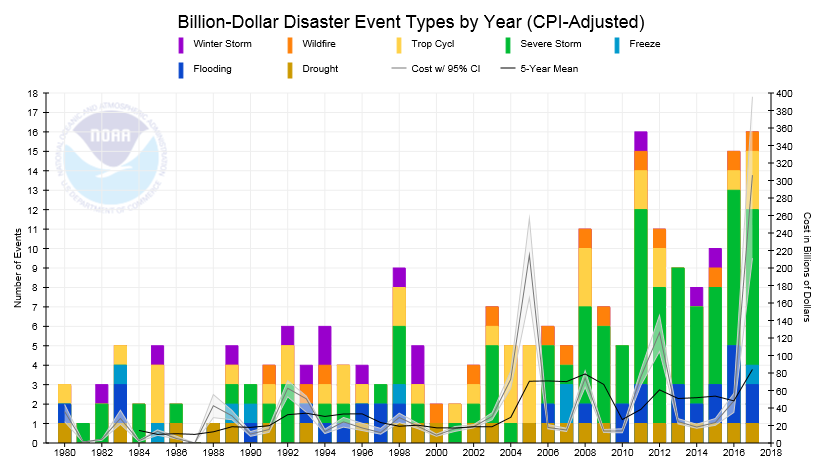
The critical need for windstorm impact reduction efforts was made more apparent by the severe impacts that the U.S. experienced during the 2017 record-setting hurricane season. While the full scope of the human and economic toll is still being tallied, current estimates for hurricanes Harvey, Irma and Maria stand at a staggering $267 billion and more than 300 lives lost. In fact, since 1980, the nation has experienced $862 billion in economic losses from hurricanes alone. If all weather and climate-related disasters are included, that total jumps to well over $1.5 trillion. Additionally, the sheer number of events exceeding the inflation-adjusted billion-dollar threshold has also increased markedly since 1980.
Aside from the incredible damage impact statistics, are there any other measurements that make the 2017 hurricane season so remarkable? I mean, from a purely scientific standpoint, what else stood out?
First, understanding the 2017 hurricane season or any other hurricane season requires consideration of the broad seasonal (i.e., June 1 - November 30) atmospheric and oceanic conditions in which hurricanes form and develop. Hurricanes require warm tropical oceans combined with an atmospheric environment that has low wind shear—a change in wind direction and/or speed with height. An easy way to think of these two influences is that the warm ocean water provides the fuel for the hurricane while low wind shear allows there to be no impediments to hurricane formation and development. So paradoxically, the most powerful hurricanes are born and thrive in a calm tropical atmospheric environment.
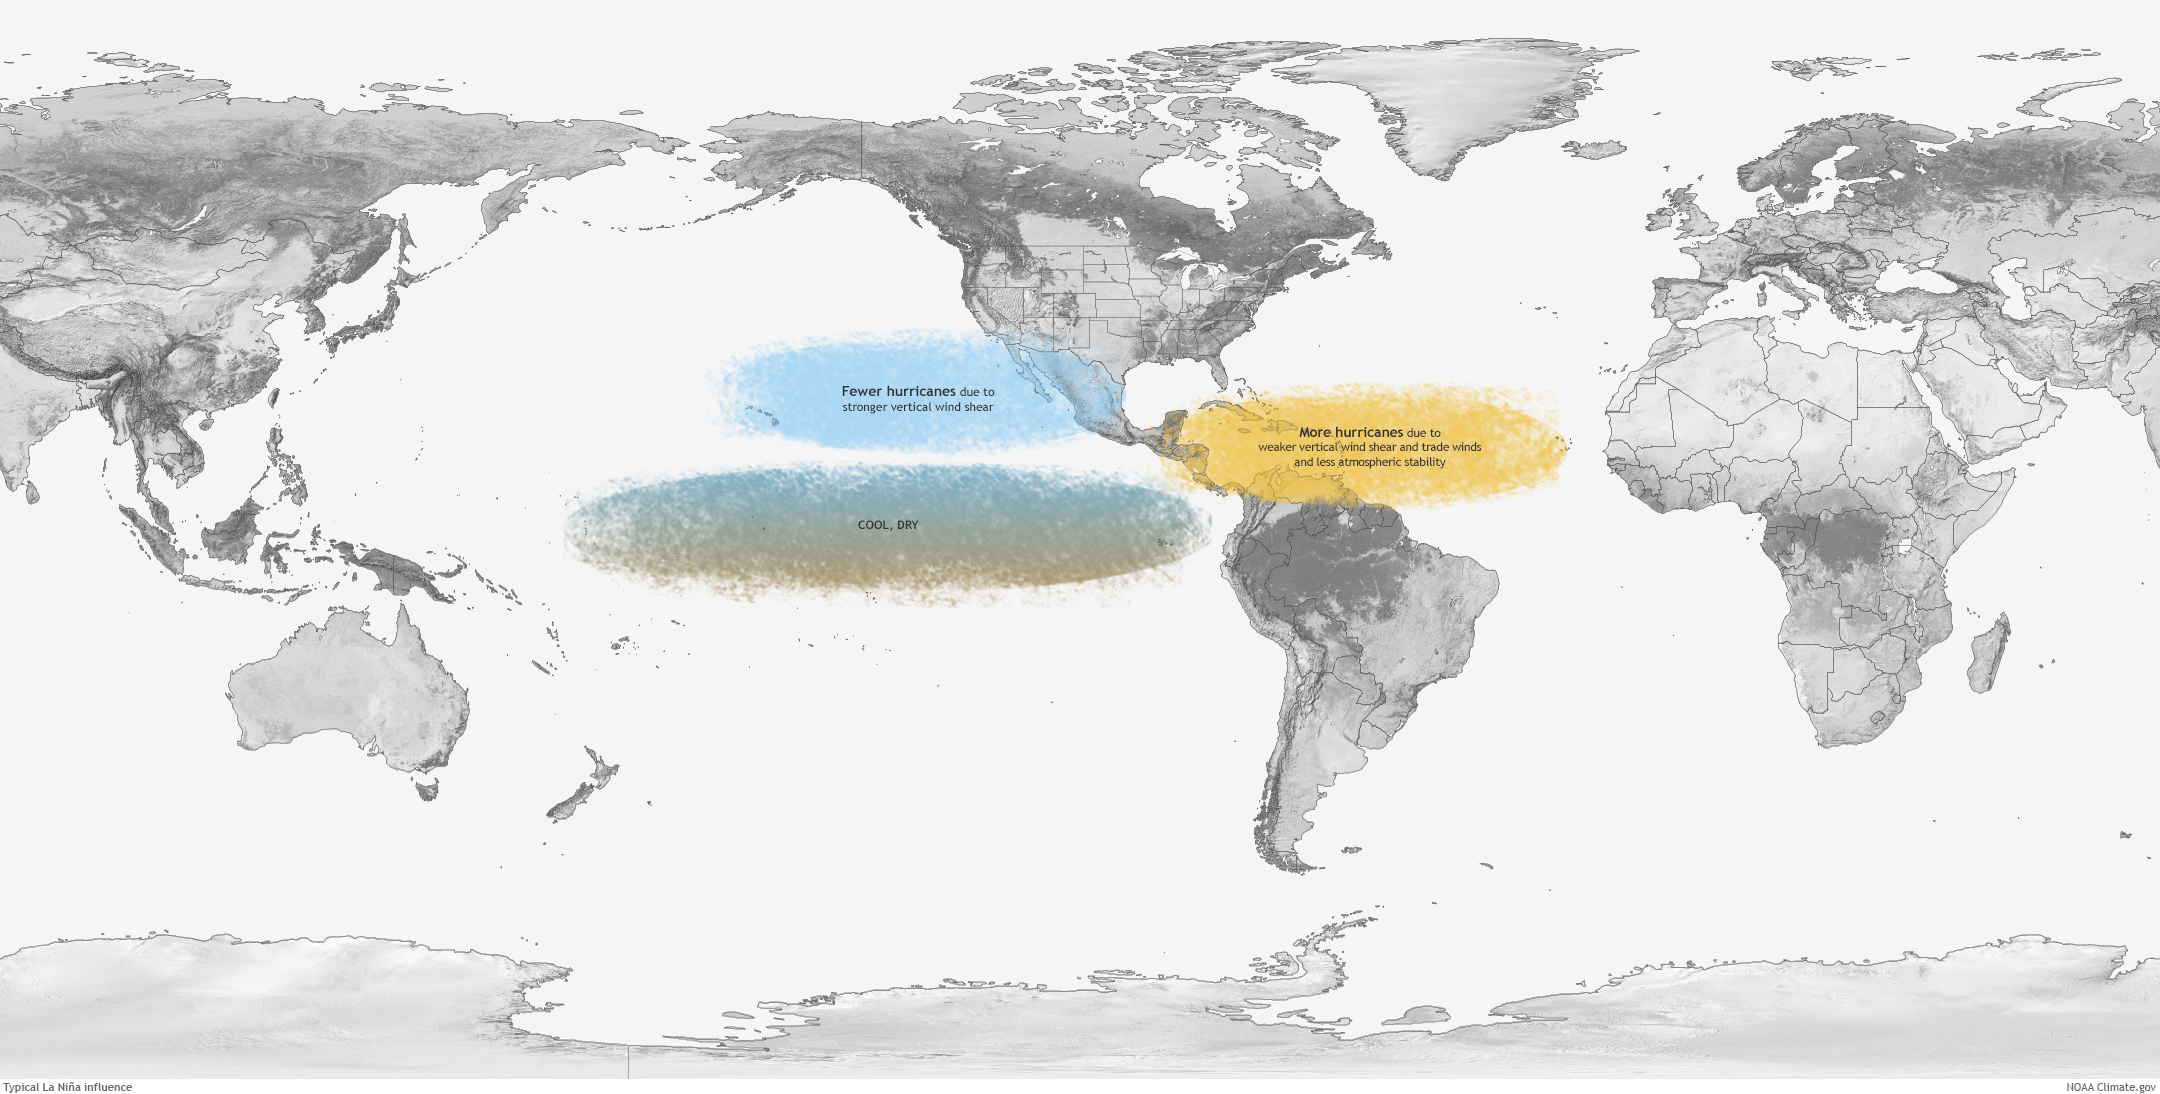
Early in the 2017 season, oceanic and atmospheric measurements taken from the vast array of ocean- and satellite-based tropical ocean measuring systems showed that the Atlantic Ocean was warmer than average and had low atmospheric wind shear. Surprisingly, the tropical Pacific Ocean phenomenon La Niña has a considerable calming influence on the Atlantic atmosphere. Indeed, the presence of either an eastern Pacific El Niño (warmer than average Pacific Ocean temperatures) or La Niña (colder than average Pacific Ocean temperatures) are among the primary drivers of the strength and number of hurricanes in the Atlantic. How so? Like using the heat from your stove to boil water, El Niño warms the atmosphere from below. And just like those boiling bubbles running around furiously in your pot of water, El Niño strengthens the wind shear effect over very large areas of the tropical Atlantic, inhibiting hurricane formation. On the other hand, La Niña cooling promotes a healthy environment for hurricanes to blossom.
The prediction models being fed these measurements had projected that both the warm Atlantic Ocean temperatures and the La Niña-induced low Atlantic wind shear environment would likely persist throughout the 2017 hurricane season. Accordingly, NOAA’s 2017 hurricane forecast called for a highly active season, and as we now know, that’s exactly what transpired.
From a scientific standpoint, the 2017 hurricane season made for some awe-inspiring measurements, mostly associated with Hurricanes Harvey, Irma and Maria.
Here are a few highlights:
- Hurricane Harvey, the first major hurricane to make landfall since Hurricane Wilma in 2005, dumped a U.S. continental record amount of rain on the greater Houston area with a peak measured amount of 1.58 meters (60.58 inches).
- Hurricane Irma’s top measured winds of 285 kilometers per hour (180 mph) are the strongest on record for an Atlantic basin storm outside of the Caribbean Sea or the Gulf of Mexico.
- Hurricane Maria was the strongest hurricane of the 2017 season as measured by atmospheric pressure and is widely regarded as the worst natural disaster ever to strike Puerto Rico.
While all three of the major hurricanes to strike the U.S. in 2017 caused incredible damage, the devastation in Puerto Rico was unrivaled in scope. Unfortunately, the unique combination of the intensity of the hurricane itself, variations in geography, and vulnerability patterns of the built environment paved the way for one of the worst disasters in U.S. history.
In an effort to make recommendations for how to improve the resilience of Puerto Rico and other U.S. communities, NIST is leading a technical investigation of Hurricane Maria and its aftermath. This interdisciplinary study will focus on how the confluence of meteorological, sociological, economic and engineering factors all contributed to the disaster.
The impact of Hurricane Maria on Puerto Rico is a stark reminder that, whether or not NOAA’s 2018 seasonal hurricane outlook pans out, it’s critical to remember that it only takes one hurricane to cause a major disaster. However, by investigating the causes and effects of storms like these, we can begin to improve our ability to withstand and recover from them. So, while we likely will never be able to stop hurricanes and other wind-related severe weather from happening, we can lessen their impact, saving lives and property.
About the author

Related Posts

Comments
Thank you for reading the post. Indeed, last season threw a lot of challenges our way.
Thank you Scott Weaver for a highly informative and simplified illustration of the importance of learning from the past to mitigate future impacts of hurricanes and storms.
The importance and urgency is your pointing out that it takes one bad storm to cause extreme damage.
Just one life lost is too much but when numbers exceed hundreds of lives prematurely lost is a cause for heightened mitigation programs.
It humbling to know NIST is pioneering and partnering with other like minded Instituons.
Keep up the good work and thank you for the lessons learnt.
Thank you for reading the post and for recognizing the importance of NIST's role in reducing disaster impacts. The perspective that the engineering and community resilience efforts at NIST bring to the table is vital to bridging the gap between the storm data/forecast product providers and applications/users to mitigate windstorm impacts.
Great post - chart is enlightening. Interesting the switch around the turn of the millenia from pre-2000 winter storms and post-2000 wildfire and the increase in [green] storms and droughts. Would be nice to see the green broken out into Hurricane categories 3, 4 and 5?
Thanks for reading the post. There is so much to dissect from the figure that you mention. The increase in the number of events in recent years is mostly attributed to severe storms like tornadoes/derechos/thunderstorms (green), but those are typically on the order of a few billion dollars per event (save two of the 2011 tornado outbreaks). While, in general, it is harder to discern an increasing trend in the number of events for tropical cyclones/hurricanes (yellow) when they occur they tend to cause in the tens of billions of dollars per event over the last couple of decades - an order of magnitude more than inland severe weather outbreaks. Obviously, this is due to the larger geographic area impacted by a hurricane when compared to a tornado (or other severe weather). Please go here for more information on Billion dollar disasters. http://www.ncdc.noaa.gov/billions/ The tabs on the left provide state specific information, the time series included in the blog post, and a table that has more detailed information on each event form 1980-current. If you have time to do a little digging the table will provide you with the information to answer your hurricane category question.
Thanks for the post Scott. That was a tricky season.