
Official websites use .gov
A .gov website belongs to an official government organization in the United States.
Secure .gov websites use HTTPS
A lock (
) or https:// means you’ve safely connected to the .gov website. Share sensitive information only on official, secure websites.
Visualization of High Performance Concrete
Visualization of High Performance Concrete
Summary:
Concrete is the most widely used building material, so any improvement in the design of this material, for example, cost, durability, or strength, ripples through the economy. This research is focused on advancing our fundamental understanding of the flow properties (rheology) of suspensions.
The visualization of this data is an important part of the validation of the computer methods and the physical ideas used in the modeling of the flow of concrete. Because of the great importance of concrete to industry and the economy, we are working to gain a greater understanding of the underlying properties of concrete. In this project, we are seeking a better fundamental understanding of the rheological properties of complex suspensions such as concrete.
We are exploring how particle shape and size distribution, as well as how inter-particle forces and their manipulation, effect the properties of suspensions in both Newtonian and non-Newtonian fluids. The simulation code, which is under active development, uses a Dissipative particle Dynamics algorithm in a highly parallel implementation to study large suspension systems with up to 75,000 inclusions (suspended particles) and over one million mesoscopic fluid particles.
The computation of inter-inclusion forces takes into account the relative velocities of the inclusions as well as the local surface curvature and surface normals at the point of interaction. The inclusions can be either spherical, ellipsoidal, or highly detailed rocks reconstructed from x-ray microtomography images of concrete samples.
The visualization of this data plays an important role in the validation of computer algorithms and the correctness of the physical ideas used in modeling complex systems like suspensions. Visualization plays an extremely important role from an educational point of view. The images can stimulate ideas concerning new phenomena that may be hard to deduce from the enormous data sets created during a computer simulation. Also, visualization can help direct the researcher in terms of what numerical tests or measures to apply to evaluate the physical behavior of the systems. An example is the strong ordering seen in the simulation of ellipsoids under shear at high solid fractions. This was unexpected and led to improved ways of quantifying such phenomena. Additionally, visualization assists in communication of research results.
Our visualizations of the cement flow simulation data have several important characteristics. First, we make use of non-photorealistic rendering for more effective depiction of the data. Second, we use real-time volumetric rendering. Both of these are based on the use of GPU shader programs.
Additional Technical Details:
Our visualizations of the cement flow simulation data have several important characteristics. First, we make use of non-photorealistic rendering for more effective depiction of the data. Second, we use real-time volumetric rendering. Both of these are based on the use of GPU shader programs.
Non Photorealistic Rendering
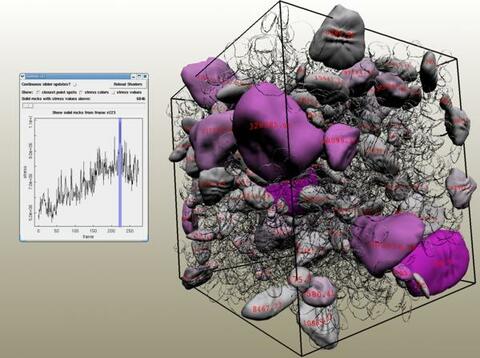
The Shader control panel gives control of several features:
- key frame -- can change to any frame in the animation. If set to -1, solid vs. outline is determined on a frame by frame bas is rather than tracking the rocks from a single key frame through the entire simulation.
- spot cutoff -- stress level for drawing red spots. Values are given in the demo/shaderData.txt file. For example, if this file includes a line saying "2: 2401.78", then a spot cutoff of 2402 would never show more than two spots on any rock in any frame of the simulation.
- silhouette cutoff -- stress level for drawing solid vs. silhouette rocks
- stress scale -- highest stress rocks are shown darker. For a key frame with lower max stress, it may be desirable to lower this to get more distinction between the rock values The rock stress values used are for the highest single point contact (not an aggregate stress over all contact points).
- stress values -- the GPU draws the stress values directly on the rocks
Real Time Volumetric Rendering via GPU Shader Programs
This technique was used to simulate a non-Newtonian suspension for the shear thinning case. This simulation is part of a study concerned with understanding the rheological properties of suspensions in non-Newtonian fluid matrices. Such suspensions are found in many products and building materials such as paint, concrete, and mortar. In this visualization we examine a suspension with a shear-thinning matrix fluid. That is, the viscosity of the fluid decreases with increasing shear rate. The visualization indicates how the local shear rates and viscosity change throughout the suspension as a constant rate of strain is applied. It is found that the shear rates rapidly rise near the boundary as the strain is applied. Further, the suspension remains highly viscous in the central portion indicating that the material away from the applied strain does not undergo as much motion. This simple observation has implications, for example, when one is interested in controlling how concrete flows as one finishes the surface.
Return to Visualization