
Official websites use .gov
A .gov website belongs to an official government organization in the United States.
Secure .gov websites use HTTPS
A lock (
) or https:// means you’ve safely connected to the .gov website. Share sensitive information only on official, secure websites.
CHAL-AMB2018-02-MP-xsection
Results Description for CHAL-AMB2018-02-AMMT-MP: Melt Pool Geometry – Width and Depth
1. Overview of Results
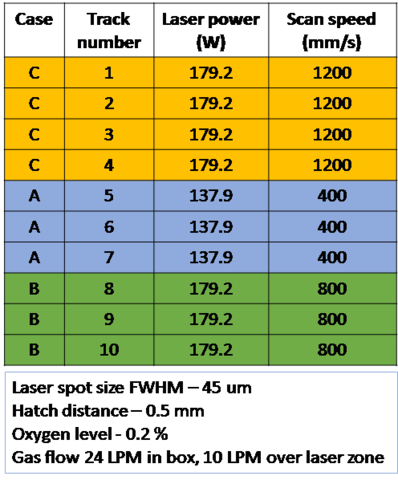
Ten laser traces were created in the ground surface of the sample at the NIST Additive Manufacturing Metrology Testbed (AMMT) using three different power and speed settings. The laser scan length for these traces was 16 mm and they were spaced 0.5 mm apart. Figure 1 is a macro photograph of the sample. The power and speed settings used at the AMMT for the laser traces are given in Table 1. A detailed description of the measurements, measurement procedures, samples, and results appear in https://link.springer.com/article/10.1007/s40192-020-00169-1.
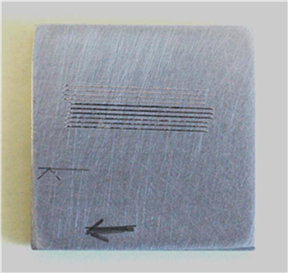
Table 1: AMMT process parameters for the topography sample
2. Melt Pool Geometry Results Summary
The sample was cross sectioned through the middle of the laser traces, mounted, and polished using standard procedures. The width and depth of all 10 traces was measured using the control software for the microscope. Table 2 shows the mean and standard deviation determined for each melt pool cross section and the mean and standard deviation determined for each speed and power class of laser trace.
Figure 2 is the stitched 13 x 5 tile composite taken with the 10x objective showing all 10 traces. This figure has been split between traces 5 and 6 to improve the aspect ratio for presentation in this report. This figure was used in subsequent analyses to ensure that the correct trace was being examined at all times. High resolution bright-field images of each cross-section are available for download at https://data.nist.gov/od/id/mds2-3830.
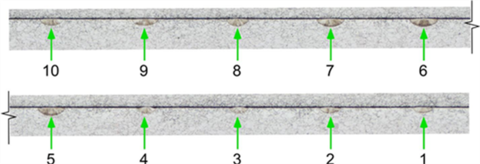
Table 2: Results of melt pool measurements using the metrology mode of the microscope control, image acquisition, and analysis software using the metrology mode. The uncertainty in the individual measurements is estimated at 0.5 µm and the average for the class type is an indicator of the stochastic variability of the process.
| Melt Pool Width, µm | Melt Pool Depth, µm | Class Width, µm | Class Depth, µm | ||||||
| Case ID | Trace No. | Mean | Std Dev | Mean | Std Dev | Mean Width | Std. Dev. | Mean Depth | Std. Dev. |
| C | 1 | 104.4 | 0.187 | 29 | 0.081 | 106 | 1.4 | 29.6 | 0.6 |
| 2 | 107.7 | 0.187 | 29.2 | 0.041 | |||||
| 3 | 106.6 | 0.071 | 30 | 0 | |||||
| 4 | 105.4 | 0.216 | 30.2 | 0.148 | |||||
| A | 5 | 144 | 0.32 | 44.4 | 0.122 | 147.9 | 3.7 | 42.5 | 1.7 |
| 6 | 151.3 | 0.071 | 41 | 0.187 | |||||
| 7 | 148.5 | 0.357 | 42.1 | 0.108 | |||||
| B | 8 | 116.4 | 0.187 | 38.2 | 0.179 | 123.5 | 6.5 | 36 | 1.9 |
| 9 | 129.1 | 0.142 | 34.8 | 0.041 | |||||
| 10 | 124.9 | 0.204 | 34.9 | 0.147 | |||||
Contacts
-
(301) 975-6032
-
(301) 975-2265