
Official websites use .gov
A .gov website belongs to an official government organization in the United States.
Secure .gov websites use HTTPS
A lock (
) or https:// means you’ve safely connected to the .gov website. Share sensitive information only on official, secure websites.
Quantifying the environmental contributions to mass change
Summary
Since the inception of the SI system of units, physical mass artifacts have been disseminated in order to realize the unit of the kilogram, essential to a broad range of measurements in the marketplace ranging from weight to electrical energy. The practice of disseminating the kilogram relies on a multi-tiered comparison of mass artifacts (physical objects) of different ranks. For more than a century, the uppermost tier contained a single “Le Grand Kilogram” that was the singular kilogram, but in 2018 it was replaced by a system using Planck’s constant and realized through the Kibble Balance. However, even with the new primary realization, each of the physical ‘daughter’ artifacts calibrated by the Kibble balance is sensitive to its environmental history and each absolute mass will vary in time. As a piece of the larger effort to improve NIST’s dissemination of mass, we are examining the microscopic processes that contribute to long time changes in the absolute mass of artifacts used in the dissemination chain and the tools that are used to measure them. This involves the development and implementation of ultra-sensitive resonators for micro-weighing with sub-monolayer sensitivity to loading, connecting these measurements to the SI when needed and embedding for lifecycle monitoring when possible.
Description
Experiments using two types of centimeter scale oscillators are described: the double paddle oscillator (DPO) and a commercial quartz crystal microbalance (QCM).
Double Paddle Oscillator (DPO)
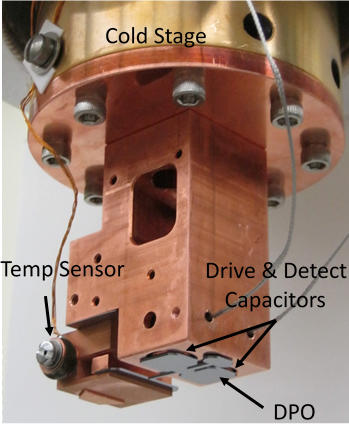
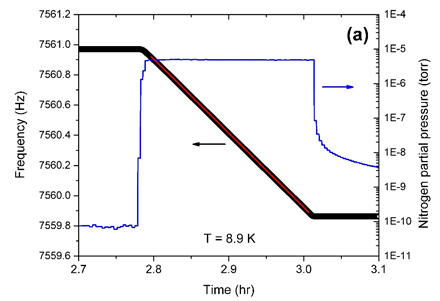
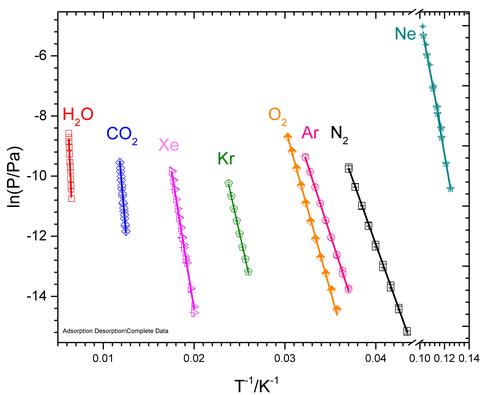
Since mass changes are mostly on the surface of mass artifacts, we have implemented a micro-weighing sensor with a very large surface area of ≈6 cm2 to optimize sensitivity to area. A photograph of the DPO sensor is shown in Figure 1, mounted on the cryo-cooler stage that allows the temperature of the assembly to be varied from 4 K – 500 K. This assembly is inserted into a UHV vacuum chamber that is equipped with multi-gas leak capability so that the sensor can be exposed to a wide partial pressure range of a gas (or multiple gasses). Shown in Figure 2 is an example of a mass change measurement on a DPO held at 8.9 K when N2 gas is introduced. As the N2 gas sublimates into ice on the DPO, the DPO mass increases and the resonance frequency downshifts linearly with the loading. Using this sensitivity to changes in mass, we can grow solid phase films at low temperatures, and then raise the temperature in successive steps and monitor the mass loss through sublimation or evaporation. The mass loss measurements shown in Figure 3 were used to improve fundamental thermodynamics data on enthalpies of sublimation.
Quartz Crystal Microbalance (QCM)
While the DPO features large area and a superb “quality factor” at low temperatures, the QCM is another large area resonant mass sensor ubiquitously used in science and industry, shown in Figure 4(a). The QCM retains a high level of performance and sensitivity over a large range of environmental conditions allowing it to be embedded in industrial thin film growth and etching tools. For mass metrology it can provide measurements in the microgram regime and potentially act as an environmental monitor for surface loading on daughter mass artifacts. To strengthen confidence in the QCM’s measurements, we conducted an experiment designed to assess the QCM’s accuracy tied directly to SI linked artifacts.
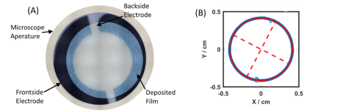
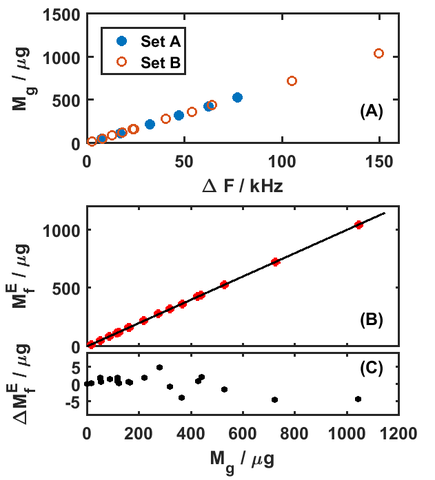
The experiment was conducted by gravimetrically comparing a QCM crystal to SI calibrated masses before and after depositing a gold film, and then using the difference to determine the mass of the film. During the deposition of the gold film, the resonance frequency of the QCM crystal was measured before and after so that the change in resonance frequency could be compared to the known change in mass. The change in frequency was then converted to a predicted mass using accepted mathematical functions. As part of the process, we needed to accurately assess the area over which the film was deposited in order to get absolute mass (g) from the mass density (g/cm2), which led to us using special dimensional metrology as shown in Figure 4(b). Then, the predicted mass from the frequency change was compared against the independently measured gravimetric mass, shown in Figure 5. The bottom panel shows the difference between the gravimetric mass and the frequency-based mass measurements. We found that the absolute mass reported by the QCM is accurate to about 1%, limited by our ability to determine the area on which the film was deposited.