
Official websites use .gov
A .gov website belongs to an official government organization in the United States.
Secure .gov websites use HTTPS
A lock (
) or https:// means you’ve safely connected to the .gov website. Share sensitive information only on official, secure websites.
Summary
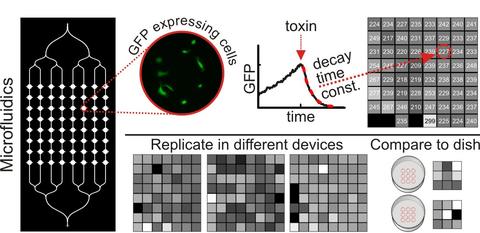
Microfluidic technologies show promise as miniaturized, portable platforms for cell assays, but must be tested to establish confidence of within-device consistency, assurance of day-to-day reproducibility, and clear understanding of how experimental conditions may affect outcomes. As an example, we assessed repeatability in a 64-chamber microfluidic device and measured reproducibility in devices prepared on different days, tested robustness using different illumination sources and reservoir-to-device tubing choices, determined performance across a range of cell loading densities, and compared results from microfluidic devices and larger volume traditional assays.
Description

Photograph of the 51-inlet microfluidic chip shown with food coloring flowing through the square chambers (1 mm per side). The food coloring represents different chemical treatments that would be delivered to cells inside each chamber.
Impact and Customers
Our work establishes metrics for measurement quality and reproducibility for cell-based assays within microfluidic devices. Many novel microfluidic devices are being created that permit new measurements or enable new biological functions to be tested; however, characterizations necessary to benchmark the quality and reproducibility of these novel systems are often lacking. Companies that hope to market new instruments and products associated with medical diagnostic and therapeutic applications will require methods to validate the capabilities of these nascent technologies. We published a framework for cell-based measurements in microfluidic devices in Analytical Chemistry in 2011. A follow-up study was published in Lab on a Chip (2012). Both the FBI and the Bioterrorism Response Laboratory at the Massachusetts Department of Public Health are interested in using this assay for analysis of ricin activity.
Approach
Microfluidic devices were constructed from polydimethylsiloxane (PDMS) using standard techniques. We designed a simple test bed device with a single inlet and a large number of chambers for cells. The inlet channel branches into eight columns of chambers, and each column contains eight 1.1 mm diameter chambers for a total of 64 chambers. African green monkey kidney epithelial (Vero) cells transfected to express green fluorescent protein (GFP) were loaded into the device to create a gradient of cell densities across the columns of chambers, thus enabling us to test whether cell density had any effect on the assay readout and to determine measurement confidence limits as a function of cell density. We studied GFP expression in the cells with quantitative time-lapse fluorescence microscopy, monitoring the rate at which GFP degrades in cells after they are treated with a reversible ribosome inhibitor, cycloheximide (CHX). The rate of decay of GFP fluorescence in cells is a measure of the effect of CHX, which blocks protein synthesis. The GFP decay rates upon CHX injection in microfluidic devices were compared with results from larger scale culture conditions of cells in 35 mm polystyrene dishes and in dishes coated with PDMS. Cell proliferation and migration rates were calculated from single-cell tracking measurements.
Major Accomplishments
We addressed the robustness of the microfluidic assay by repeating experiments under conditions that might change the quality of the assay. Despite the potential toxic effects of tubing leachables and increased variability in data collected with mercury arc lamp illumination, we found no significant difference in the time course of GFP decay in response to CHX (mean GFP decay time constant of 240 min with standard deviation of 13 min). The measurements of GFP decay under different conditions had small within-experiment variations: the maximum coefficient of variation (CV) was 14%. From the ranges of cell density plated in the microfluidic chambers, we determined that a sample of at least 100 cells (167 cells/mm2) was necessary to estimate the GFP degradation rate for a population such that the uncertainty due to sampling is less than the uncertainty due to fitting (Figure 1).
| Figure 1. Experimental time constants for GFP decay following CHX treatment. Error bars denote 95% confidence limits from fitting. Red dotted line indicates approximate confidence limits as a function of cell density. |
We also compared the microfluidic results to results from the assay performed under larger volume conditions and found similar measurements of GFP decay rate constants. However, the confidence bounds for the larger scale conditions were approximately twice as broad as the confidence bounds for the microfluidic measurements of GFP decay. This finding indicates that, for a given number of cells, microfluidic devices provide a higher level of confidence in the measurement of CHX-induced GFP decay. This result was primarily due to lower fluorescence background in the microfluidics devices, which have inherently lower autofluorescence than polystyrene and which contain less autofluorescent cell culture medium. Further analysis of the proliferation and migration data illustrate that some cell behaviors within microfluidic devices did differ from larger scale culture conditions. The cells in the microfluidics experiments were determined to have nearly three-fold slower proliferation rates, yet migration rates were significantly faster than cells cultured in dishes. Follow-up imaging studies suggest that differences in cell behavior may be primarily caused by differences in surface chemistry. Whereas the tissue culture polystyrene (TCPS)- and PDMS-coated dishes were hydrophobic, PDMS in the microfluidic devices was treated with oxygen plasma to bond the devices together, which rendered the surfaces hydrophilic. Using fluorescently labeled fibronectin, we found that cells in the microdevices and on plasma-treated PDMS in dishes were able to rearrange the fibronectin (Figure 2). These data are particularly enlightening in microfluidics research, where surface chemistries are not well controlled, yet differences in cell behavior are often noted.
| Figure 2. Images of GFP and fibronectin (red) fluorescence at 1 h (left) and 18 h (right) after plating cells on different PDMS substrates. |
Associated Product(s)
Download our project brief (PDF).