
Official websites use .gov
A .gov website belongs to an official government organization in the United States.
Secure .gov websites use HTTPS
A lock (
) or https:// means you’ve safely connected to the .gov website. Share sensitive information only on official, secure websites.
Summary
With the advent of automated data acquisition systems in conjunction with on-line imaging devices, the biological researcher is potentially confronted with gigabytes of bio-images which henceforth constitute the "raw data" of his/her experiment. It is an important goal of the computation biology to develop relevant IT and statistical tools/algorithms/methodologies to routinely, rigorously, and efficiently analyze such image data, so as to extract the relevant information to address the biological problem at hand.
In a joint effort, 3 divisions from ITL: the Software and Systems Division, the Applied & Computational Mathematics Division, and the Statistical Engineering Division have collaborated with members of CSTL's Biochemical Sciences Division to examine cell lines from 2 different sources:
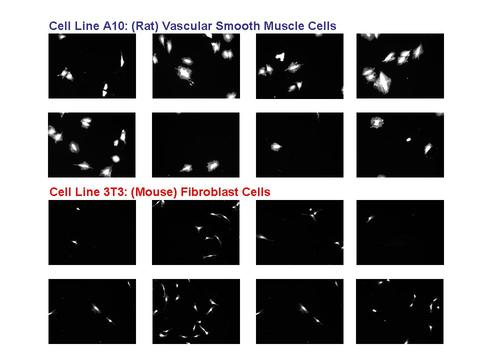
1. A10: derived from the thoracic aorta of rats and which serve as a commonly used model of vascular smooth muscle cells (VSMC), and
2. 3T3: derived from mouse fibroblast cells and which serve as a surrogate for connective tissue (bone, ligament, tendon, cartilage) cells.
The cells were image by fluorescent microscopy. The resulting data set consisted of thousands of images.
The image data was processed to differentiate between the 2 cell lines. It was determined early on that the image segmentation algorithms played a key role in the analysis and so a further analysis focused on a formal comparison of commonly used image processing algorithms, and an assessment of the robustness of the conclusions from such a comparison. About 20 such algorithms were examined, and clear distinctions between groups of such algorithms clearly became evident.
Description
The Problem: The initial project problem was to determine whether image analysis techniques existed (or could be developed by the ITL groups) which would assist in the automatic differentiation of the A10 and 3T3 cell lines. The larger problem at hand was to determine what factors (and interactions) in the image, the imaging, and the image processing algorithms are important, and what the optimal settings of such factors were that permitted maximal extraction of information and maximal differentiation of cell lines. In particular, it was important to determine and characterize the limits of existing popular image segmentation techniques, and then exceed those limits by development of improved algorithms and methodology.
Experiment Design: An experiment design was constructed to extract a random and representative set of images that would serve as valid surrogate for the larger set. The number of factors that complicated the comparison of the 2 cell lines was large:
1. cell lines (2: A10 and 3T3)
2. wells (3)
3. exposure time (3: low, medium, high)
4. optical filter (2: optimal and sub-optimal)
5. image fields (50)
6. image field reps (3)
7. day (3)
Allowing for some impossible combinations, the net result was that a baseline population of about 9000 images had been collected in the lab. An experiment design was constructed to extract about a 1% sample. The resulting test data set thus consisted of 80 images--8 images x 5 replications x 2 cell lines. This set served as the representative sample for subsequent image, cell line, and algorithm analysis.
The segmentation of an image into "cells" and "non-cells" (that is, background) was an critically important image processing step. Segmentation algorithms are highly affected by the noisiness of the background, by the fuzziness of the cell edges, and by the overall quality of the image. The image processing literature is replete with segmentation algorithms--Otsu, k-Means, Max Entropy, Canny, etc. All told, the project examined about 20 such algorithms. Obvious questions arose in regard to the algorithms under study:
1. Which were best?
2. Which were worst?
3. Was the performance of an algorithm affected by image conditions?
4. If so, which conditions?
5. Did interactions exists?
6. What algorithms allowed maximal discrimination between cell lines?
Data Analysis: A variety of data analysis techniques--both quantitative and graphical--were applied to the data. Such techniques showed dominant factors, interactions, and optimal settings. Imaging conditions played a major role in the performance of an algorithm--some algorithms performed well under certain conditions but fared poorly under alternate conditions. Statistical methodologies were developed and applied which ferreted out the robustly best (and worst) algorithms.
Statistical metrics were developed which assisted in the characterization of an algorithm. In particular, the sample set of 80 images benefited from the production/creation of ground truth via human/expert "mark ups" of the images which defined what in an image constituted a cell, what did not, and precisely where the cell borders were. Given this "ground truth", metrics could be developed which allowed for performance-assessment. In particular, a common metric for how a particular segmentation algorithm performed relative to a particular cell within a particular images was how much overlap there was between the pixels of the estimated cell (from an algorithm) and the "true" cell sub-image (from the human expert). Good algorithms would in general have large overlap; poorer algorithms would have lesser overlap.
A significant improvement achieved by the project was the gained appreciation of the limitations of any and all) univariate metrics for image quality. In light of the fundamentally multivariate nature of images and image characteristics, the creation of 2-dimensional metrics was carried out which served to be a significant improvement over any 1-dimensional metric.
Many bivariate metrics were considered and discarded. A bivariate metric was developed as part of this project which utilized the following 2 overlap statistics for evaluating (for a given cell) how a particular segmentation algorithm performed relative to the ground truth version:
TET = the % of the ground truth pixels for a cell that were also segmentation algorithm mask pixels, and conversely
TEE = the % of the segmentation algorithm pixels for a cell that were also ground truth pixels.
This bivariate metric had the virtues of symmetry, uncorrelatedness, completeness, as well as simplicity. An effective bivariate graphic was developed that plotted TET vs. TEE with color coded the cell lines and other factors on the plot. Such a plot had a much higher cell line discrimination--and provided much more insight about the effect of other factors--than did any univariate graphic. The development of such a bivariate metric and associated graphic was an important accomplishment in the project.
Major Accomplishments
1. Development of bivariate metric
2. Development of bivariate metric plot
3. Comparison and ranking of segmentation algorithms
4. Determination of important factors and interactions
5. Determination of best and worst settings
6. Development of enhanced IT methodologies for rapid image analysis
7. Assessment of virtues and limitations of the popular NIH image analysis software IMAGEJ
8. Development of cell-edge techniques
9. Development of new state-of-the-art segmentation algorithm
The following paper was written:
Alden A. Dima, John T. Elliott, James J. Filliben, Michael Halter, Adele Peskin, Javier Bernal, Benjamin L. Stottrup, Marcin Kociolek, Mary C. Brady, Hai C. Tang, and Anne L. Plant, "Comparison of Segmentation Algorithms for Fluorescence Microscopy Images of Cells", Cytometry Part A (submitted).
Additional Technical Details
