
Official websites use .gov
A .gov website belongs to an official government organization in the United States.
Secure .gov websites use HTTPS
A lock (
) or https:// means you’ve safely connected to the .gov website. Share sensitive information only on official, secure websites.
Summary
We have advanced a spectral analysis method to characterize overlapping spectral data based on two-dimensional correlation spectroscopy (2DCOS). Using advanced 2DCOS, we characterized spectral signatures associated with changes in the phase and configuration of polymers and other complex molecular systems.
Description
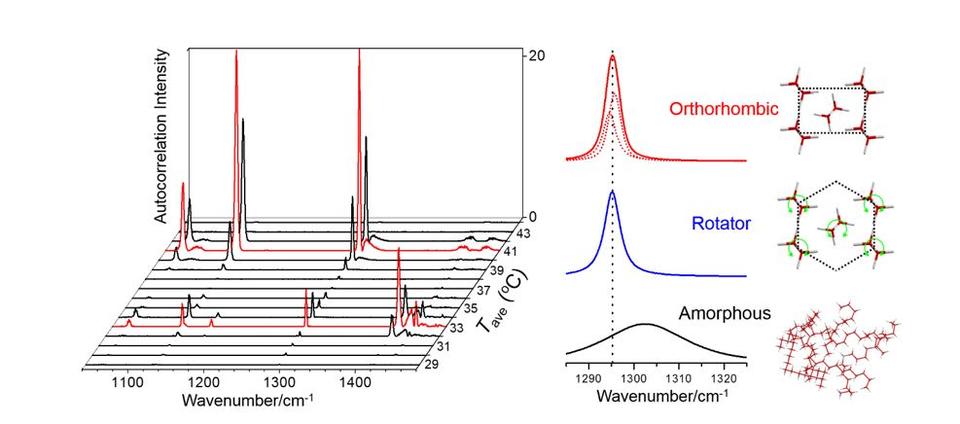
When a series of spectra are acquired from a sample as a function of temperature, pressure, electric field strength, concentration, or any experimental parameters, conventional spectral analysis is performed by monitoring the intensity change at a specific frequency. However, such a single frequency-based analysis becomes challenging if the spectral region is crowded with multiple overlapping peaks. To overcome the limitation of the univariate analysis, researchers have developed a two-dimensional correlation spectroscopy (2DCOS) method, which compares spectral intensity variations at a frequency pair with respect to a perturbation variable. 2DCOS generates positive and negative correlations between two spectral components. The results also provide sequences of certain spectral intensity changes and can be used to enhance the spectral resolution of highly overlapped spectra. 2DCOS has been applied extensively to analyze various types of spectral data from Raman and IR to X-ray, UV-Vis, and fluorescence.
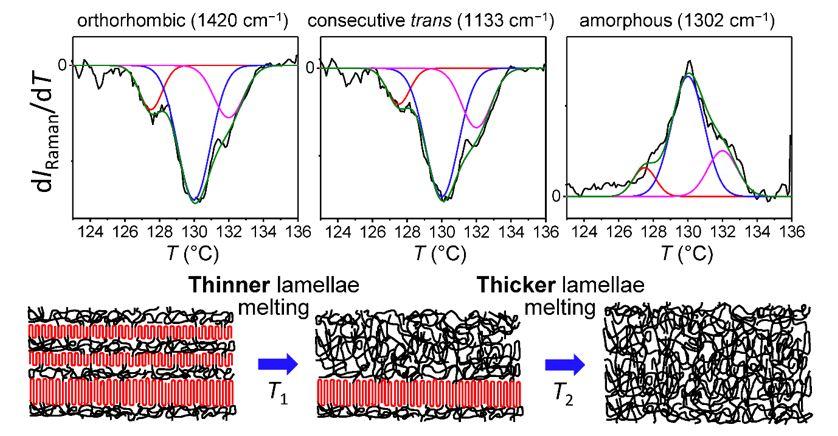
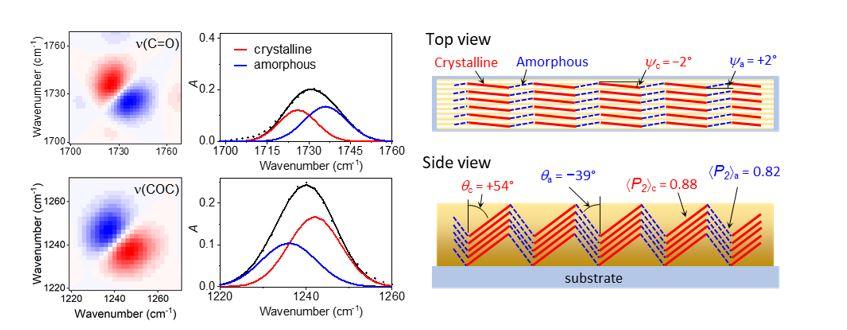
We have applied 2DCOS analysis methods to unravel the phase transitions occurring in polymers and alkanes [1,2], the hydrogen bonding in dental resin mixtures [3], and the orientational difference between crystalline and amorphous chains [4]. For advanced spectral analysis, we have developed a moving-window approach to 2DCOS [5,6] and applied it to the polymeric melting [1,2].
PUBLICATIONS
[1] Y. Jin, A. P. Kotula, A. R. Hight Walker, K. B. Migler, and Y. J. Lee, Phase-Specific Raman Analysis of n-Alkane Melting by Moving-Window Two-Dimensional Correlation Spectroscopy, J. Raman Spectrosc. 47, 1375 (2016). https://doi.org/10.1002/jrs.4967
[2] Y. Jin, A. P. Kotula, A. R. Hight Walker, K. B. Migler, and Y. J. Lee, Raman Identification of Multiple Melting Peaks of Polyethylene, Macromolecules 50, 6174 (2017). https://doi.org/10.1021/acs.macromol.7b01055
[3] I. S. Ryu, X. Liu, Y. Jin, J. Sun, and Y. J. Lee, Stoichiometric analysis of competing intermolecular hydrogen bonds using infrared spectroscopy, RSC Advances 8, 23481 (2018). https://doi.org/10.1039/c8ra02919a
[4] S. Xu, C. R. Snyder, J. Rowlette, and Y. J. Lee, Three-dimensional molecular orientation imaging of a semicrystalline polymer film under shear deformation, Macromolecules 55, 2627 (2022). https://doi.org/10.1021/acs.macromol.1c02036
[5] Y. J. Lee, Analytical and Numerical Characterization of Autocorrelation and Perturbation-Correlation Moving-Window Methods, Appl. Spectrosc. 71, 1321 (2017). https://doi.org/10.1177/0003702816681169
[6] Y. J. Lee, Least Squares Moving-Window Spectral Analysis, Appl. Spectrosc. 71, 1894 (2017). https://doi.org/10.1177/0003702816685336