
Official websites use .gov
A .gov website belongs to an official government organization in the United States.
Secure .gov websites use HTTPS
A lock (
) or https:// means you’ve safely connected to the .gov website. Share sensitive information only on official, secure websites.
FEWC725
| Name | FEWC725
|
|---|---|
| Date | |
| Description | Large Crib# 39 , high density. Hood Flow: 3 kgs / sec. Heating tape on filters at sample location. Crib on two load cells. |
| Specimen | Wood Crib
|
| Ignition | propane wand
|
| Project ID (s) | |
| Test Director | Bryant
|
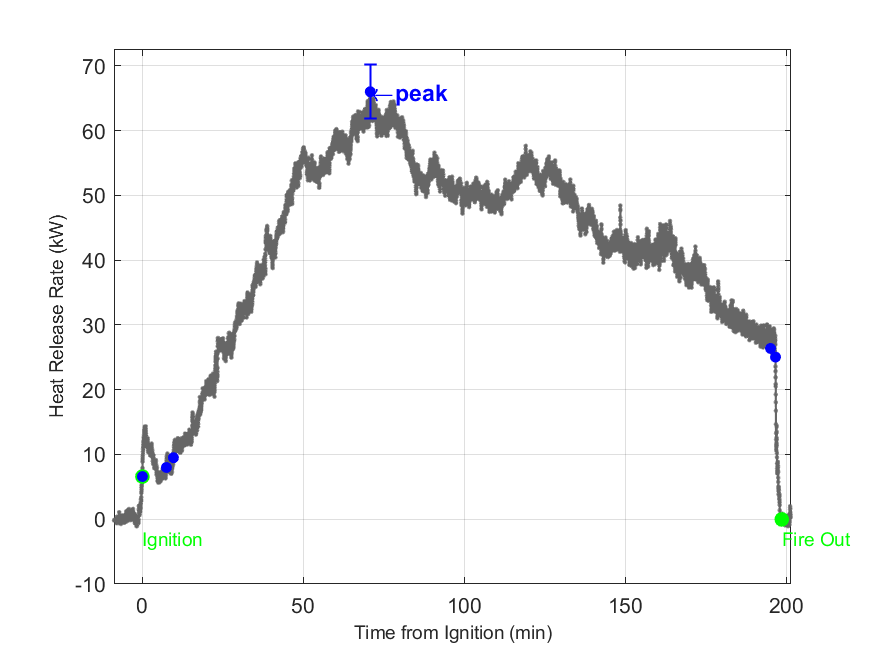
Timelapse Video with Heat Release Rate Plot
| Measurement | Value | Uc | Unit |
|---|---|---|---|
| Peak Heat Release Rate, PHRR
|
66.0
|
4.2
|
kW
|
| Time to Peak Heat Release Rate
|
70.77
|
0.07
|
min
|
| Total Heat Released, THR
|
498
|
33
|
MJ
|
| Gas Burner Total Heat Released, NGTHR
|
-35
|
- | MJ
|
| Heat Release Quality Confirmation, HRQC
|
Not measured | - | MJ/MJ
|
| Net Specimen Mass (gravimetric), NM = Mi-Mf
|
36.485
|
0.042
|
kg
|
| Net Effective Heat of Combustion = THR / NM
|
13.66
|
0.91
|
MJ/kg
|
| O2 Yield = O2 Consumed / NM
|
1.069
|
0.034
|
kg/kg
|
| CO2 Yield = CO2 Generated / NM
|
1.272
|
0.046
|
kg/kg
|
| CO Yield = CO Generated / NM
|
0.0519
|
0.0019
|
kg/kg
|
| Soot Yield = Soot Generated / NM
|
0.0114
|
0.0026
|
kg/kg
|
| Baseline Hood Exhaust Flow
|
3.076
|
0.092
|
kg/s
|
| Test Duration = Time(Fire Out) - Time(Ignition)
|
198.53
|
0.03
|
min
|
Uc = Combined Expanded Uncertainty with 95% confidence level
| Parameter | Value | Uc | Unit |
|---|---|---|---|
| Fuel Type
|
Generic
|
- | - |
| Hood Size
|
3
|
- | m
|
| Effective Duct Diameter
|
0.483
|
0.004
|
m
|
| Exhaust Flow Correction Factor
|
1.033
|
0.029
|
- |
| Net Heat of Combustion (per unit mass O2), Ef
|
13.10
|
0.66
|
MJ/kg
|
| Net Heat of Combustion(per unit mass fuel), HOCf
|
30.00
|
0.90
|
MJ/kg
|
| Initial Specimen Mass, Mi (gravimetric)
|
56.35
|
0.03
|
kg
|
| Final Specimen Mass, Mf (gravimetric)
|
19.87
|
0.03
|
kg
|
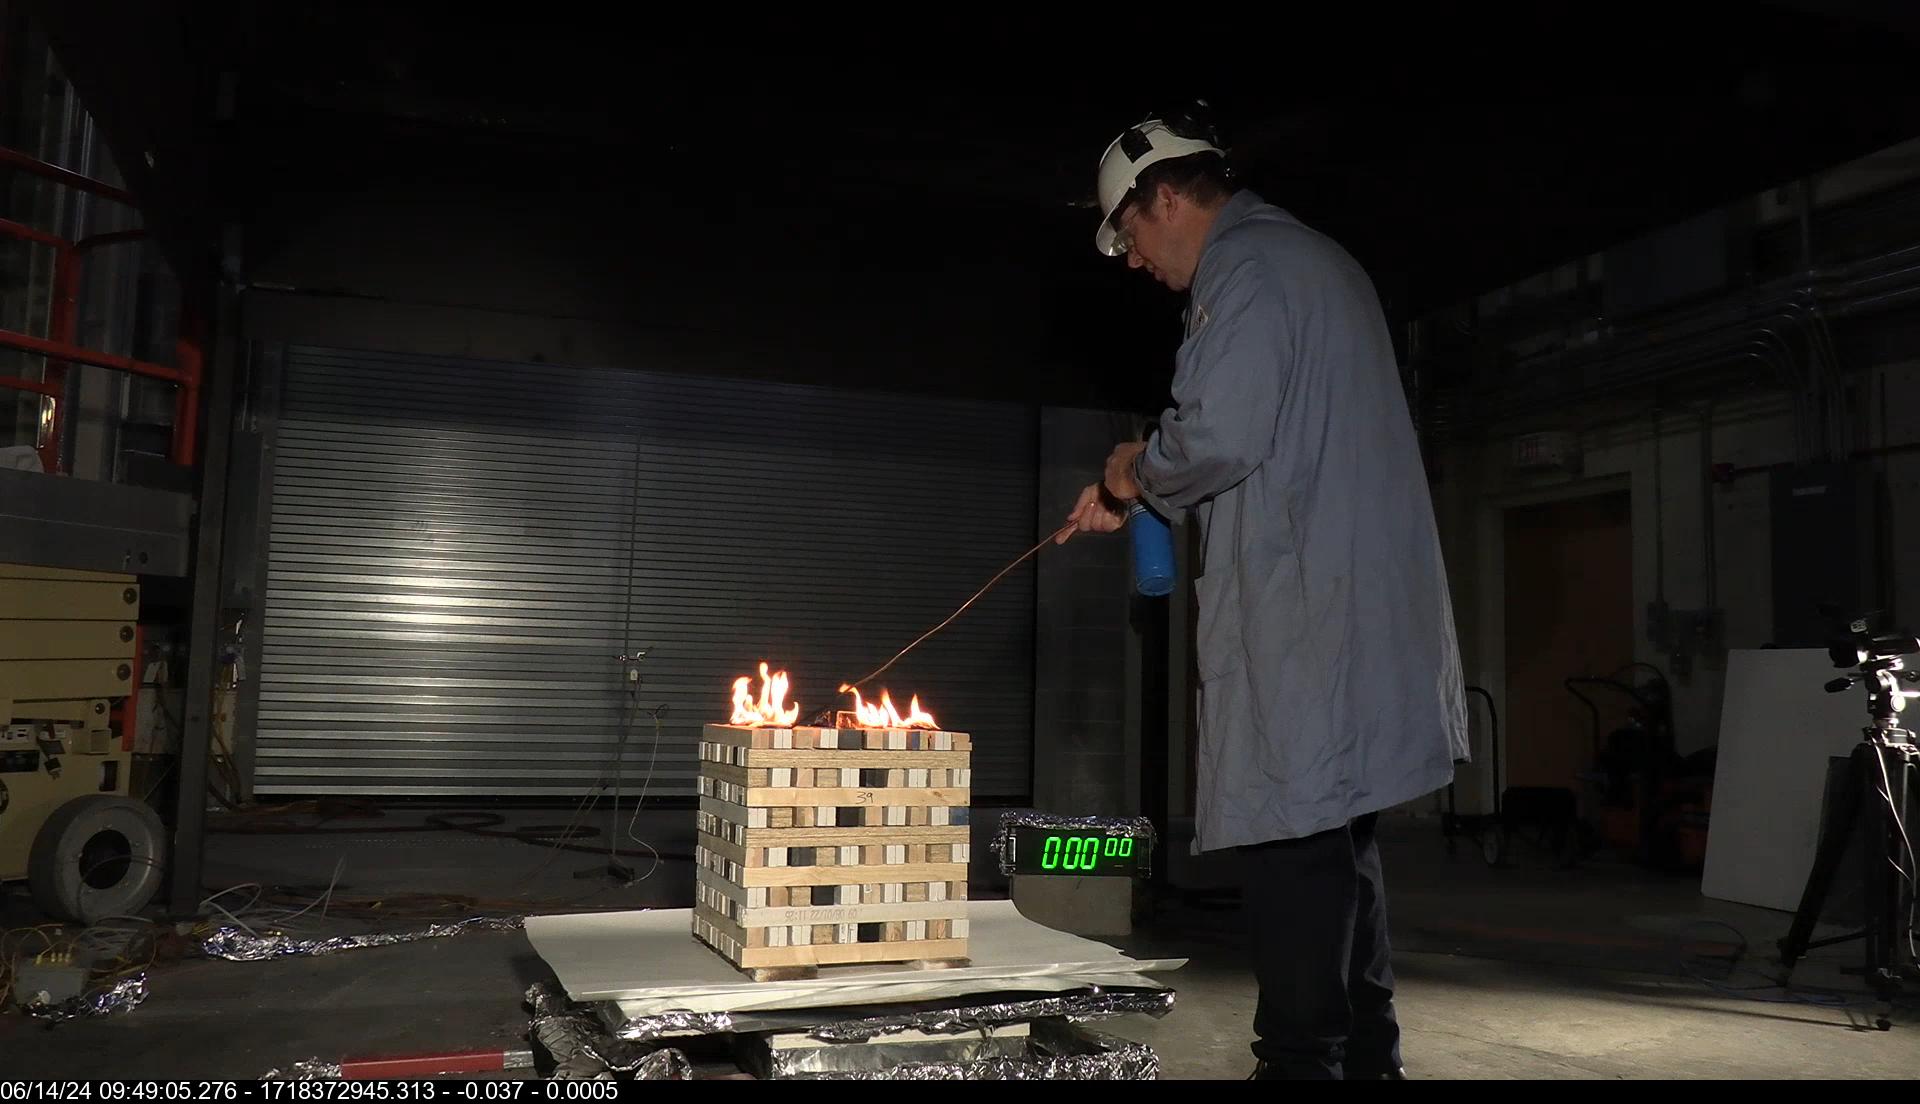
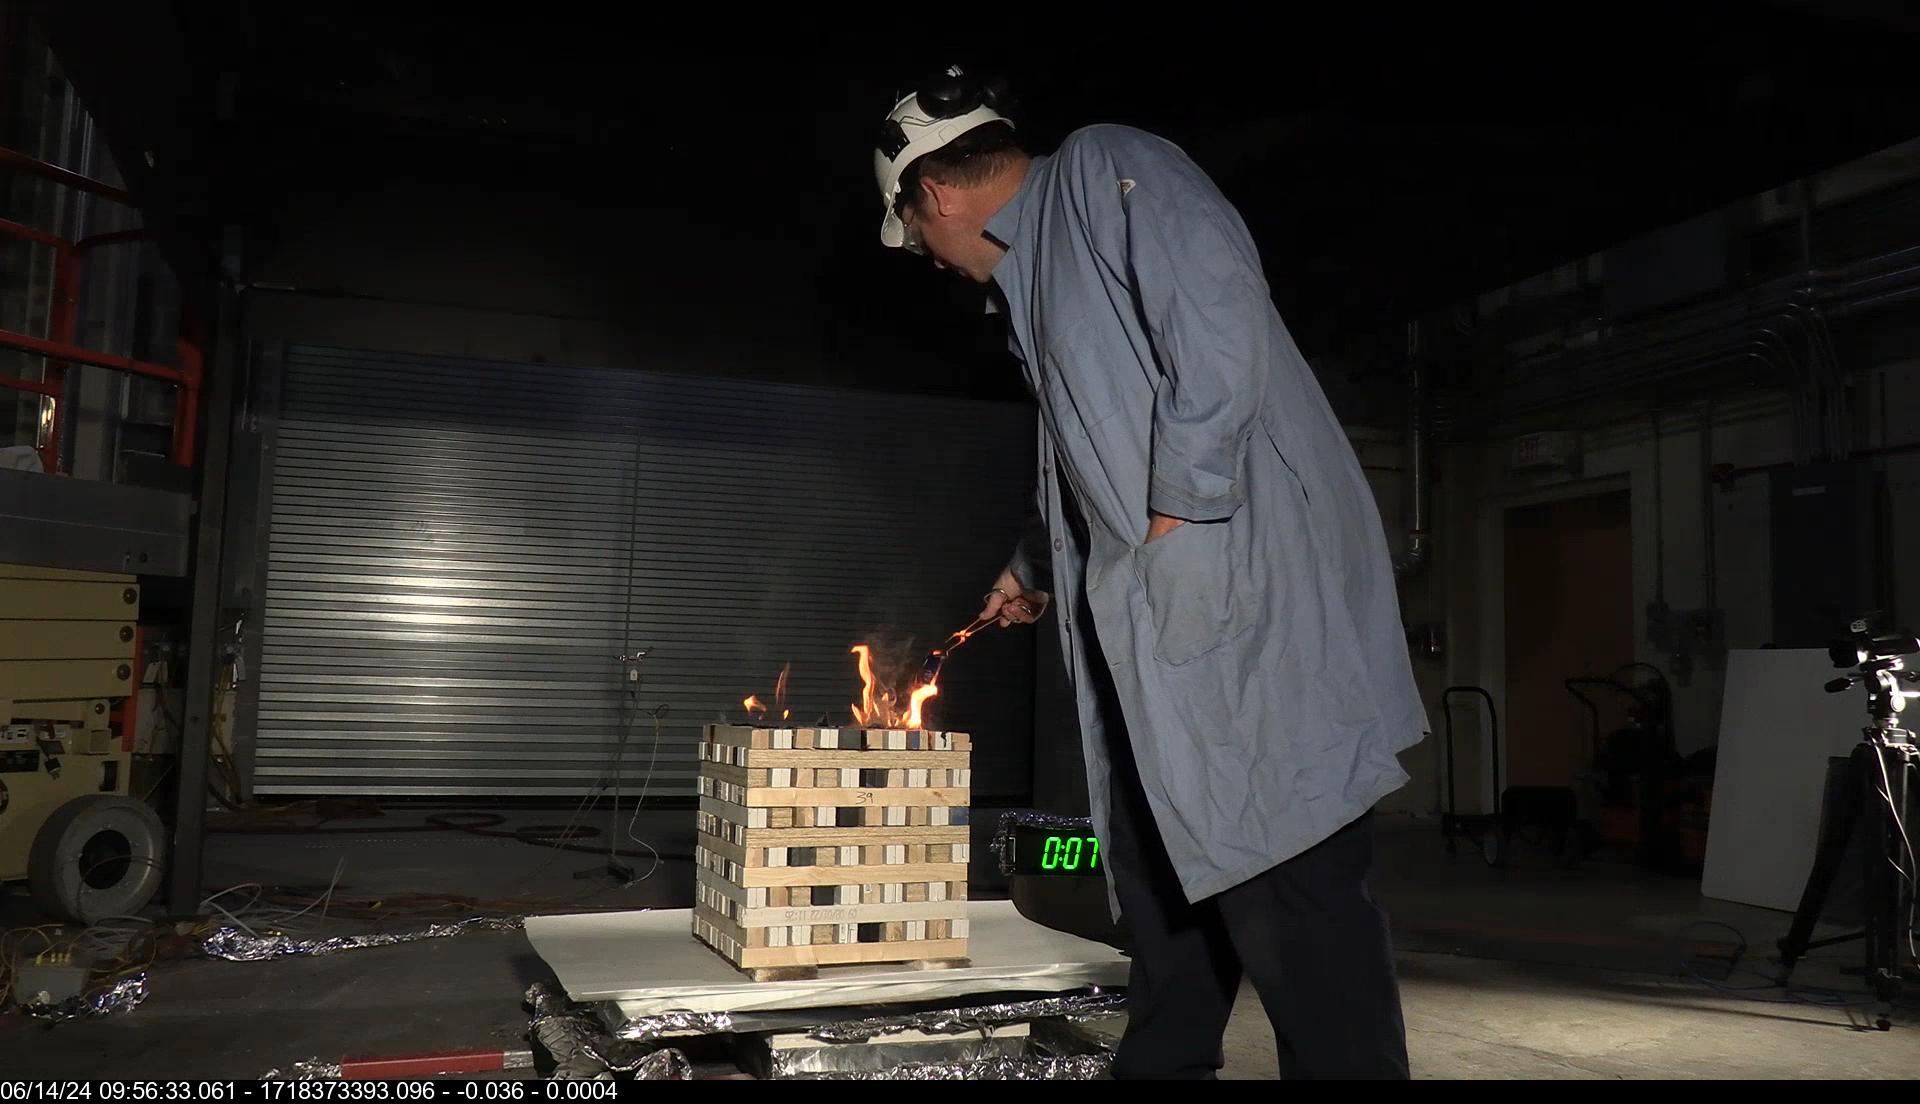
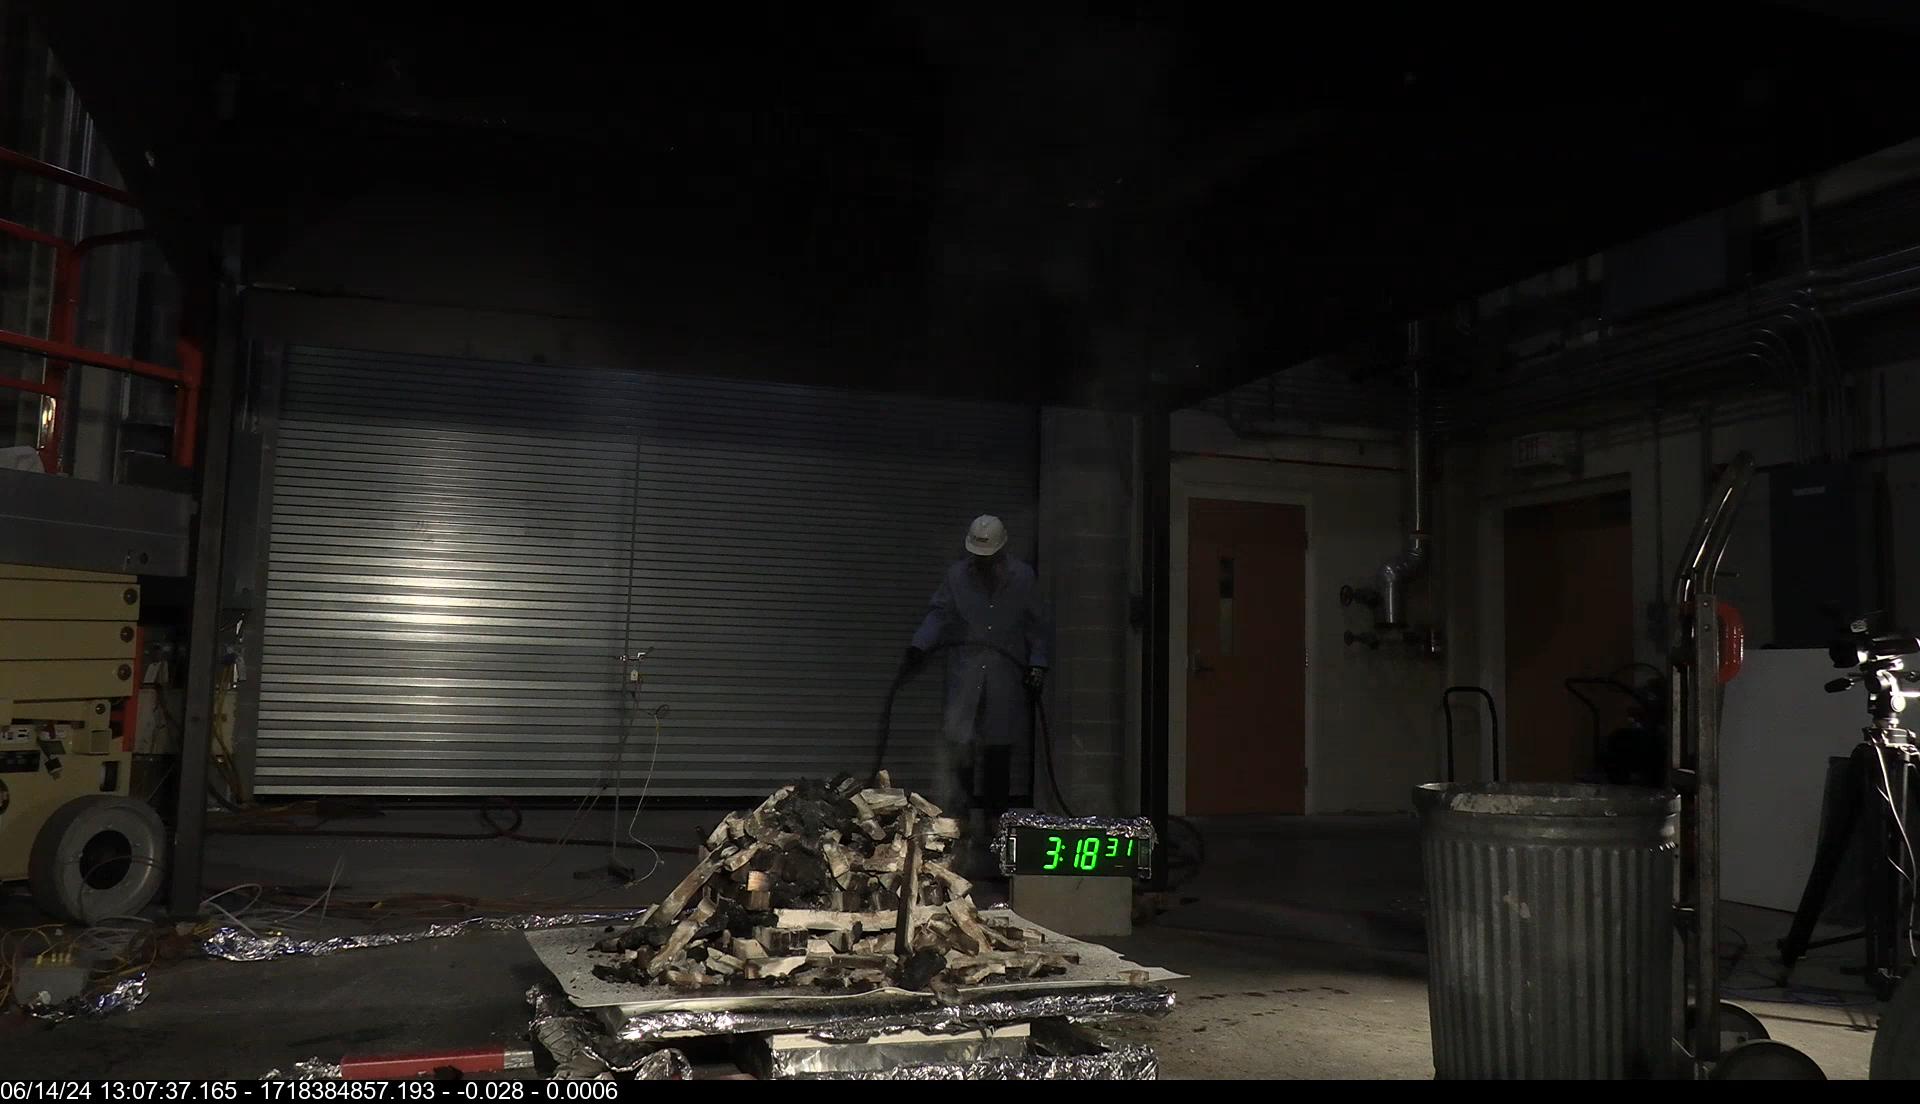
| Event | Time (min) | Description | Video Snapshot Image |
|---|---|---|---|
| 1
|
0.00
|
Ignition
|
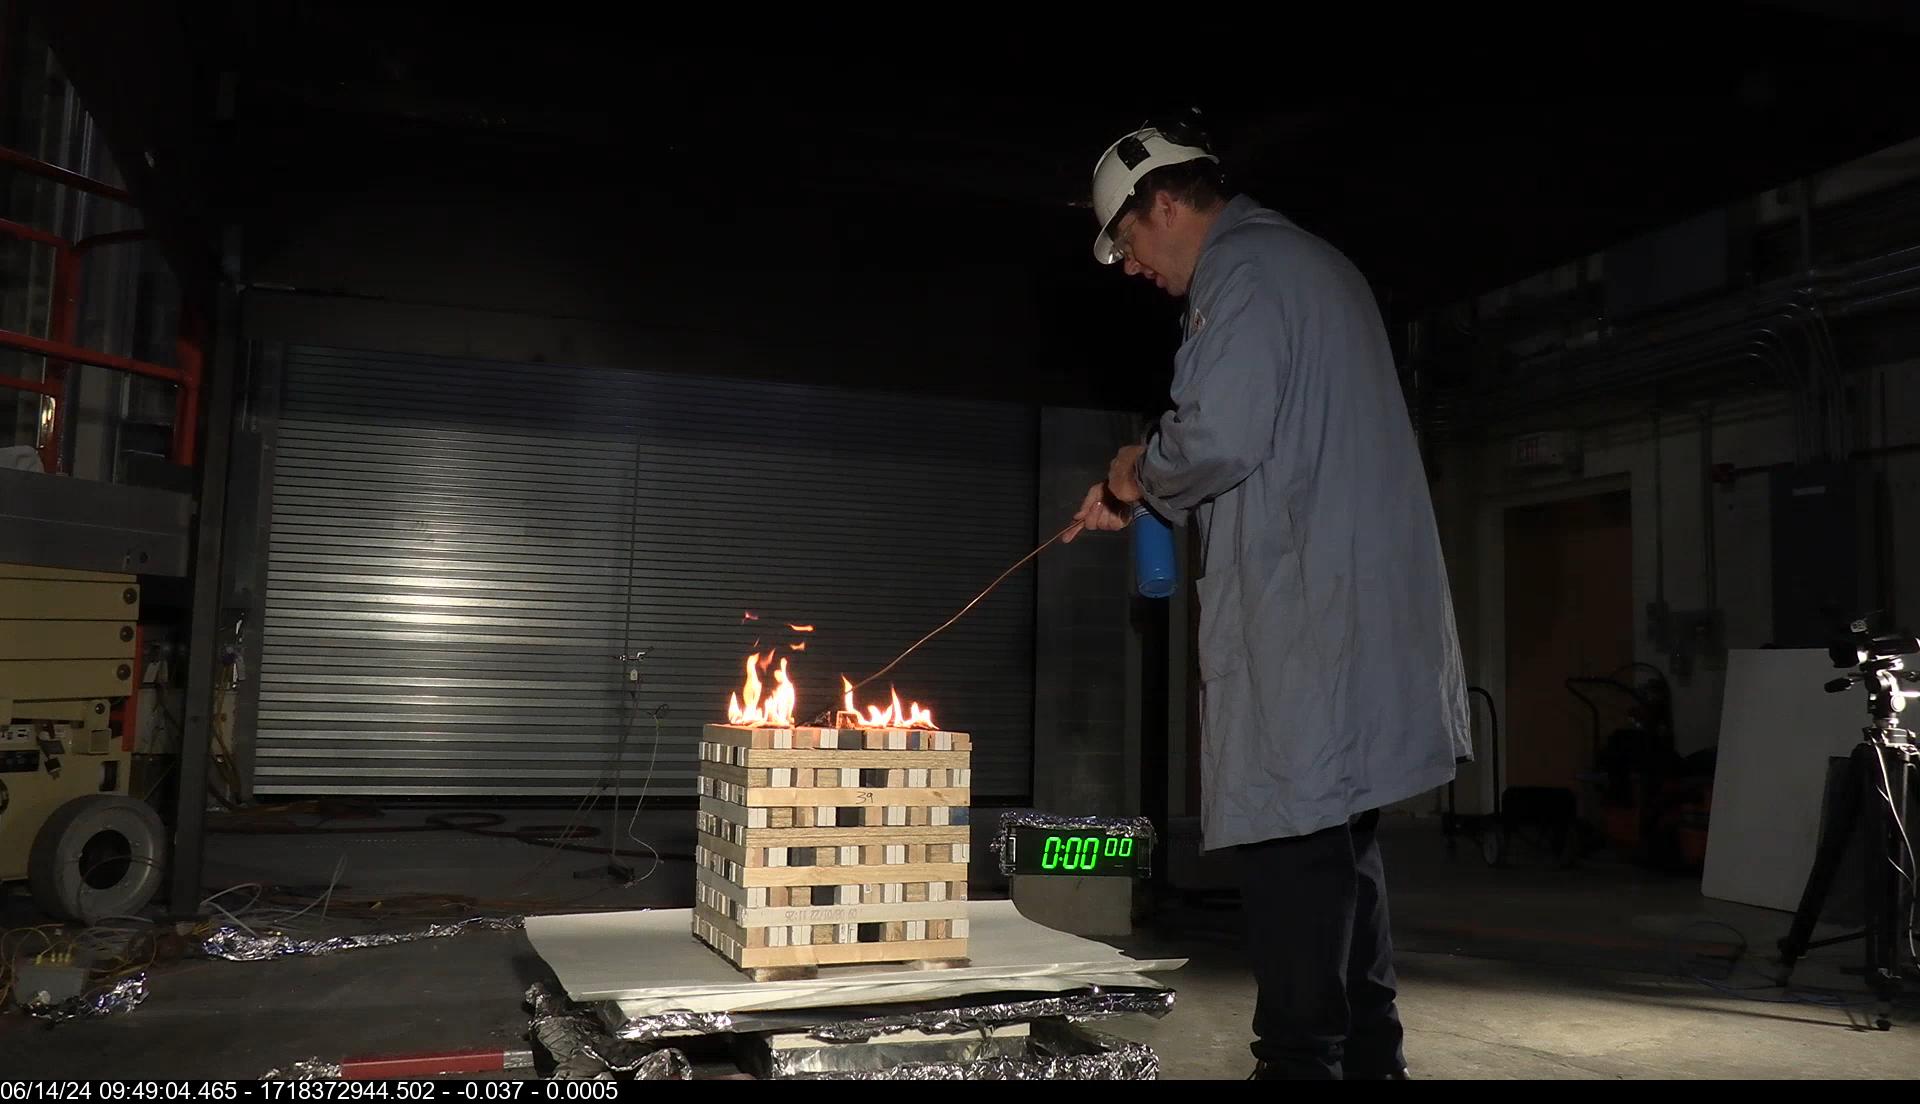
|
| 2
|
0.00
|
Sample
|
|
| 3
|
7.47
|
Adding gel pack to help ignition
|
|
| 4
|
9.63
|
propane wand ignition of gel pack
|
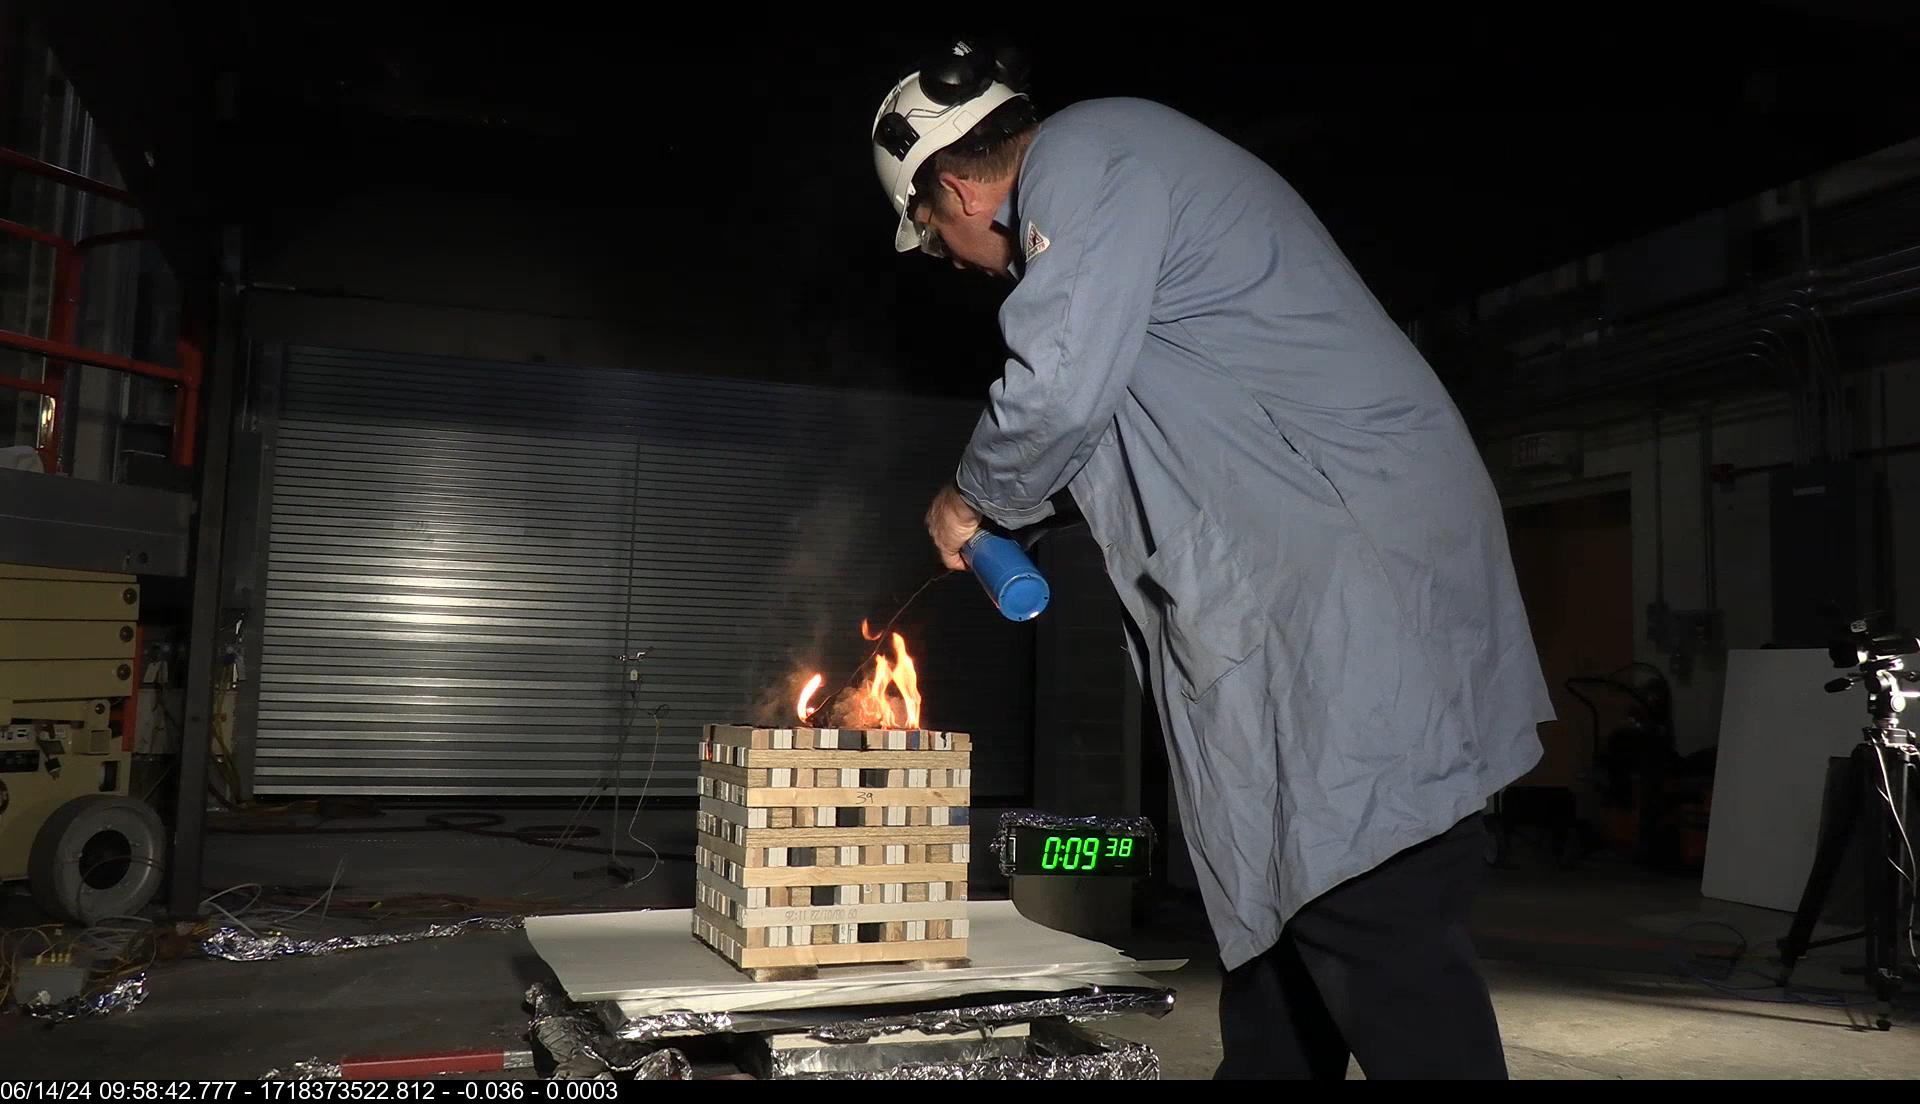
|
| peak
|
70.77
|
Peak HRR
|
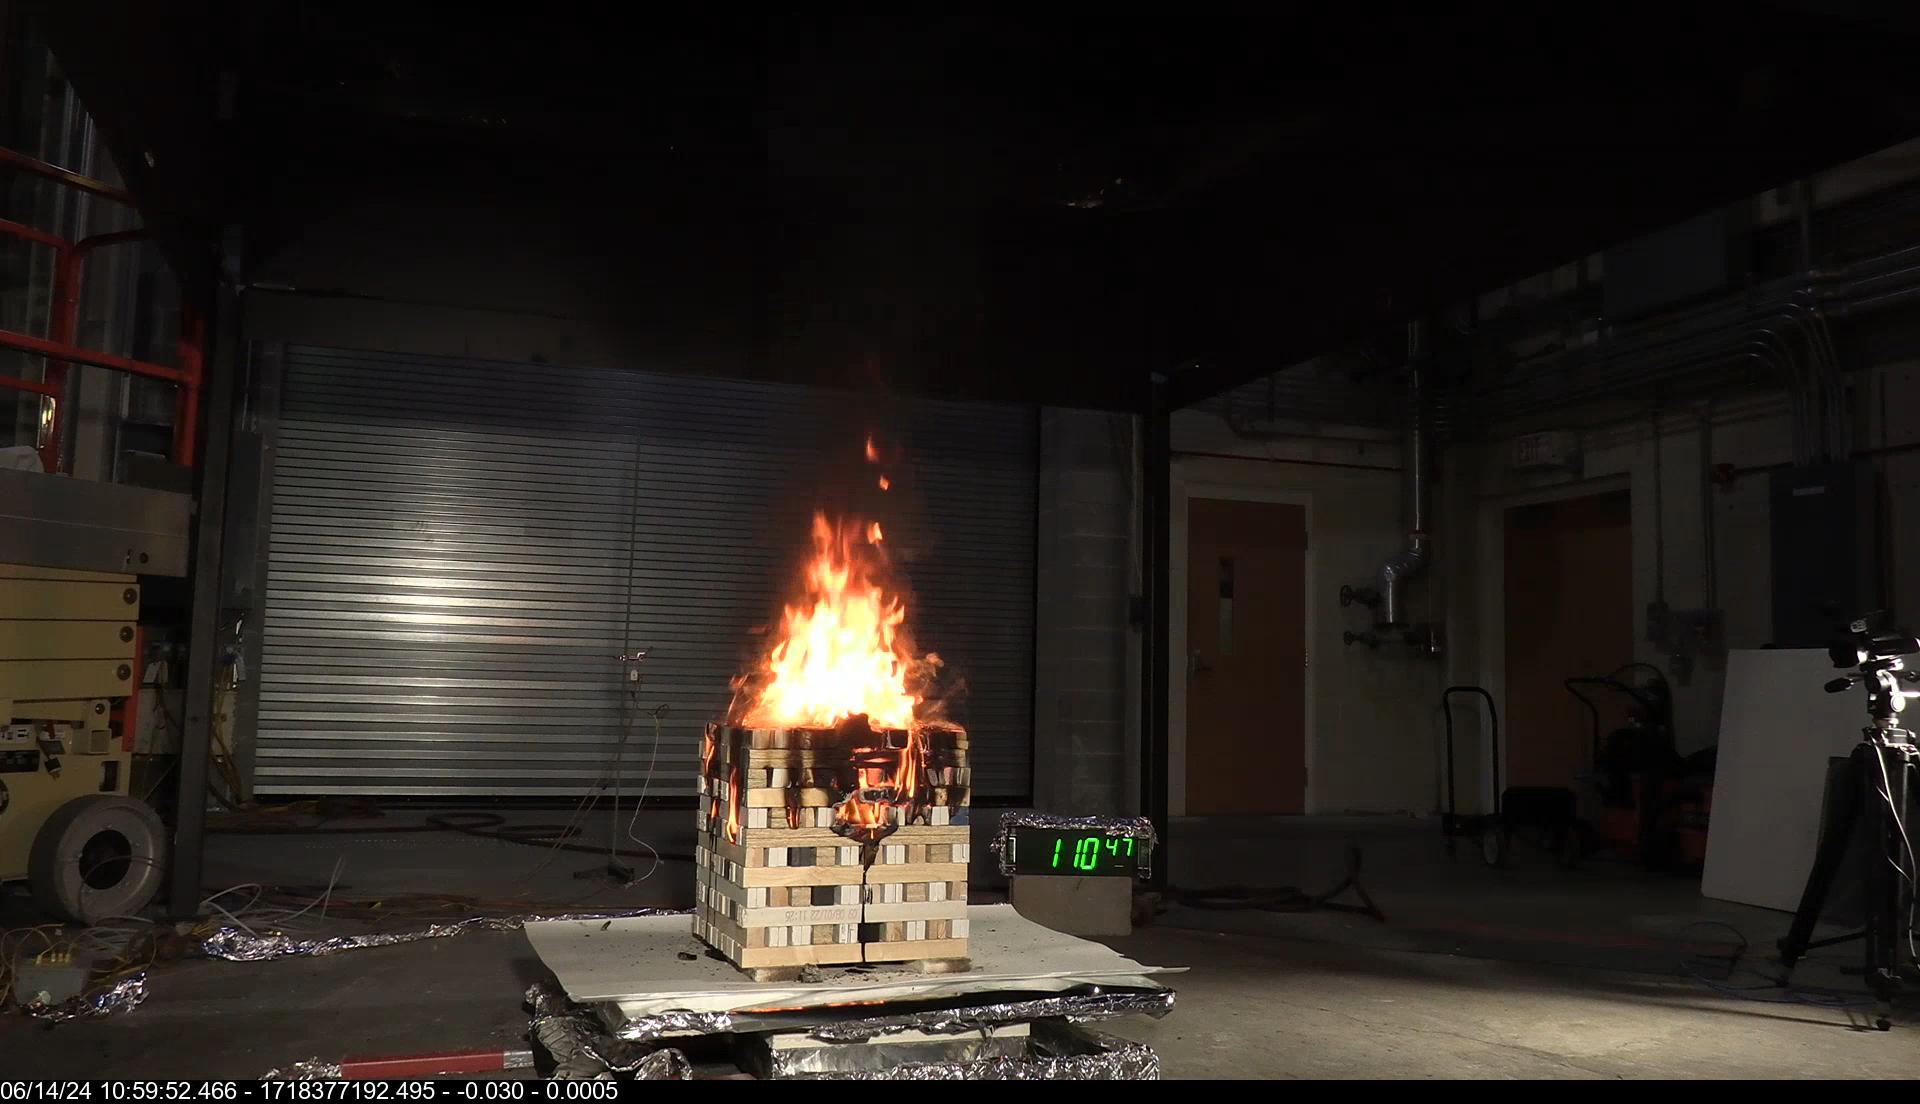
|
| 5
|
195.05
|
Bypass sample
|
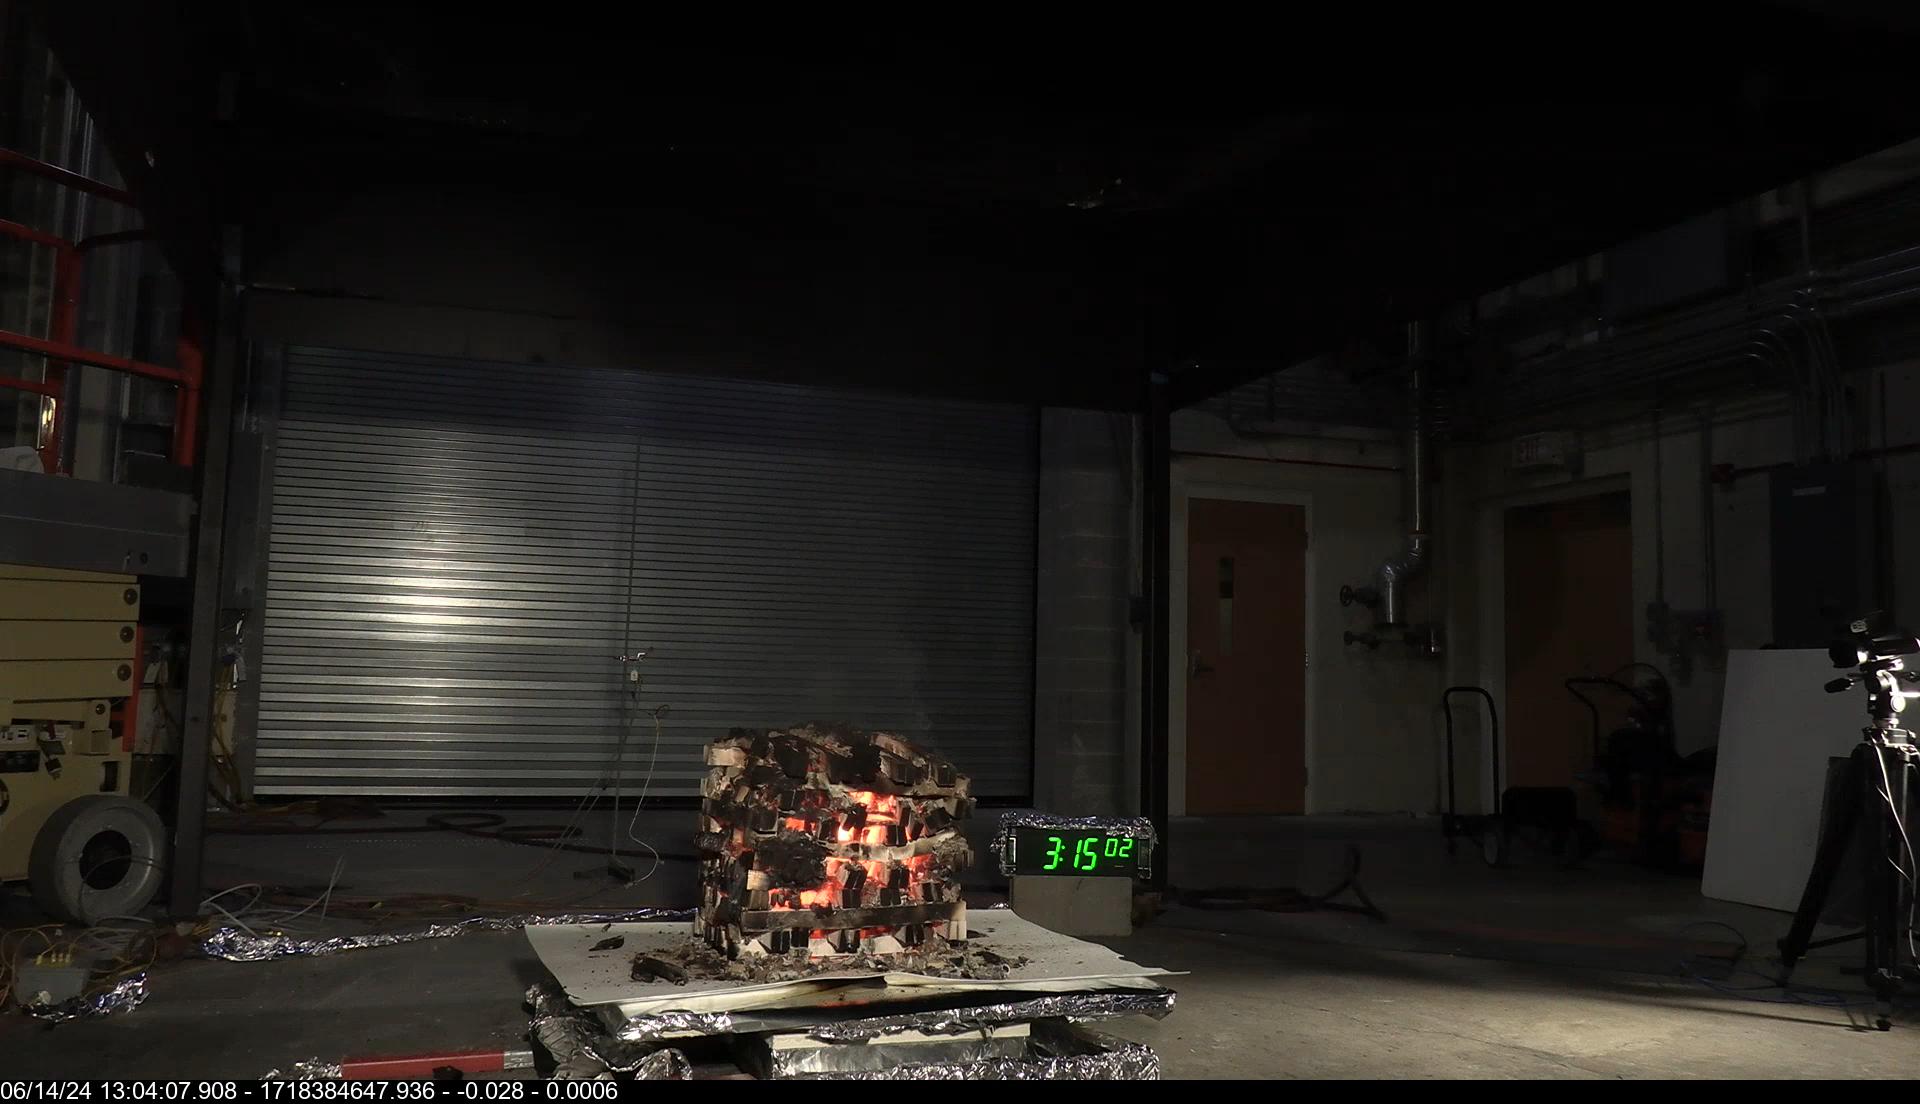
|
| 6
|
196.60
|
water suppression
|
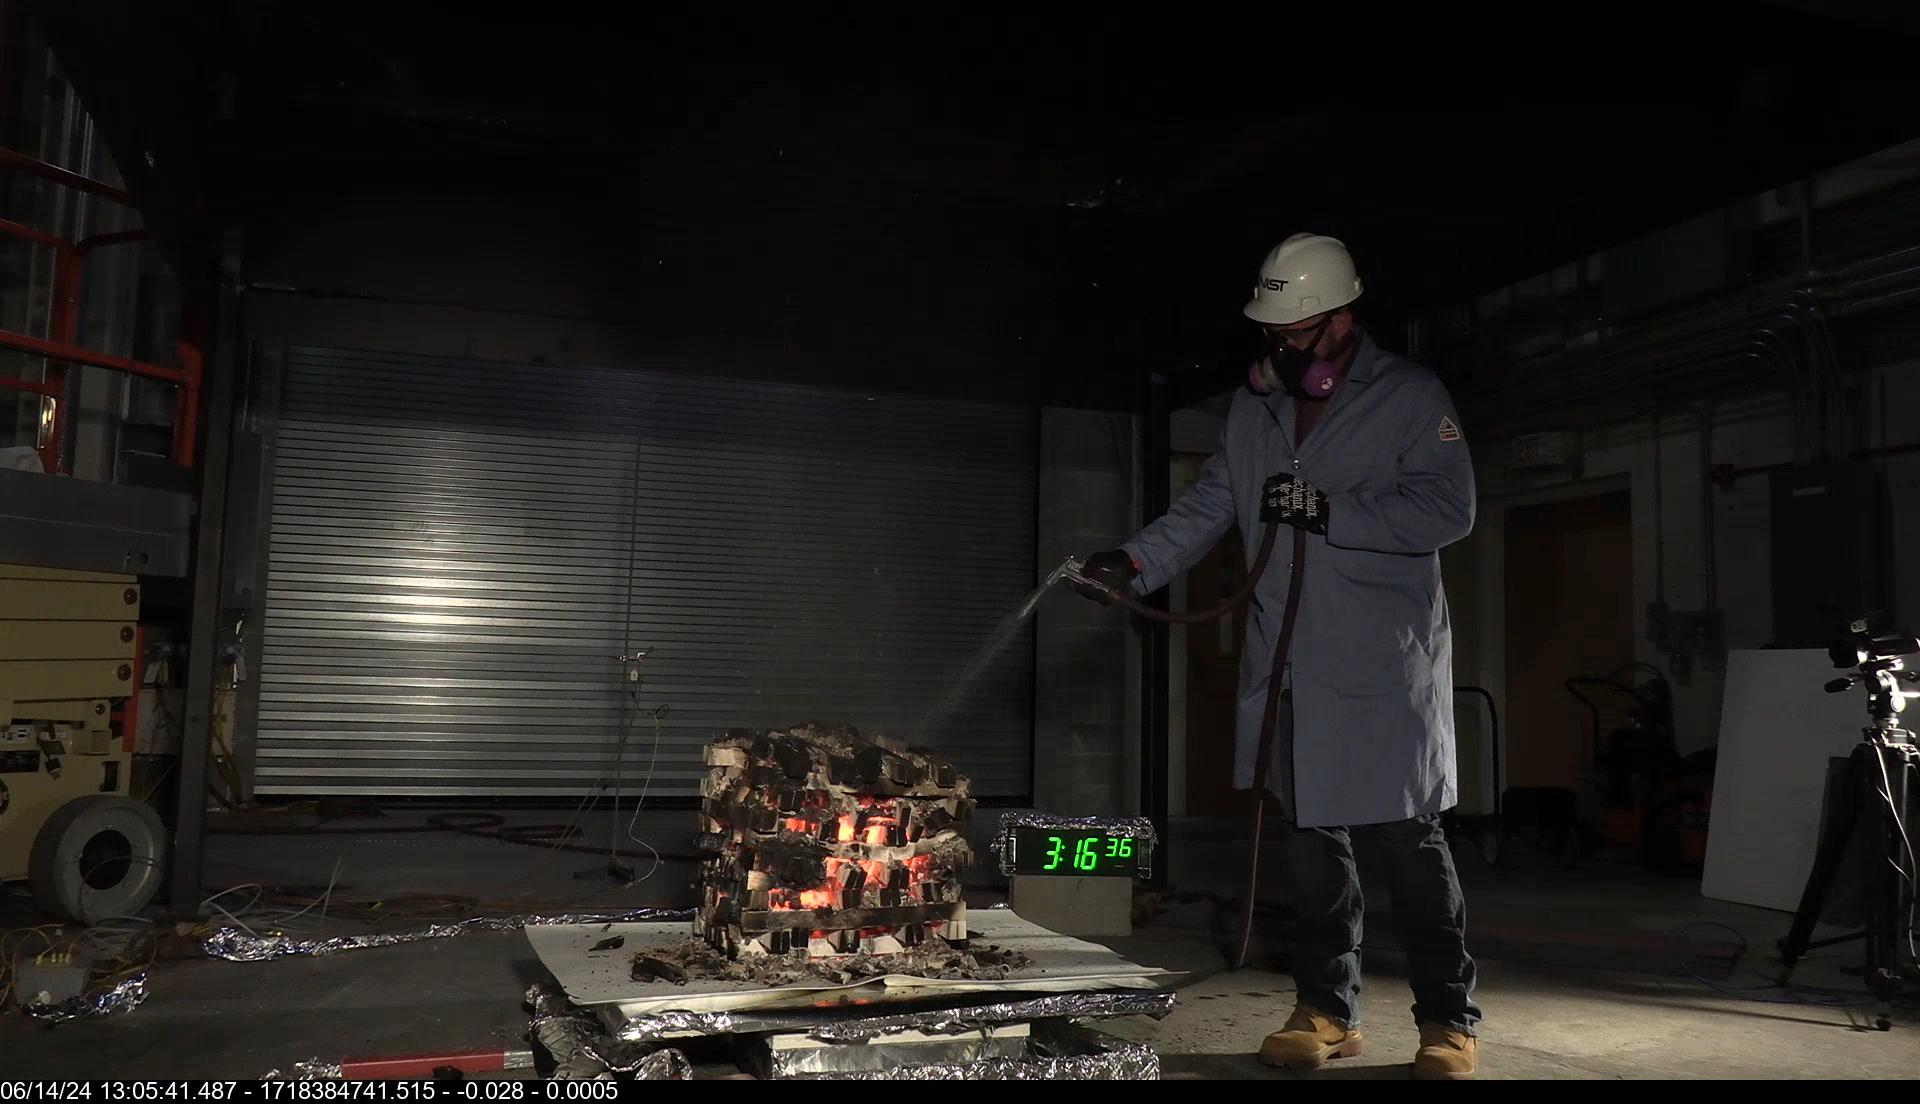
|
| 7
|
198.53
|
Fire Out
|
|
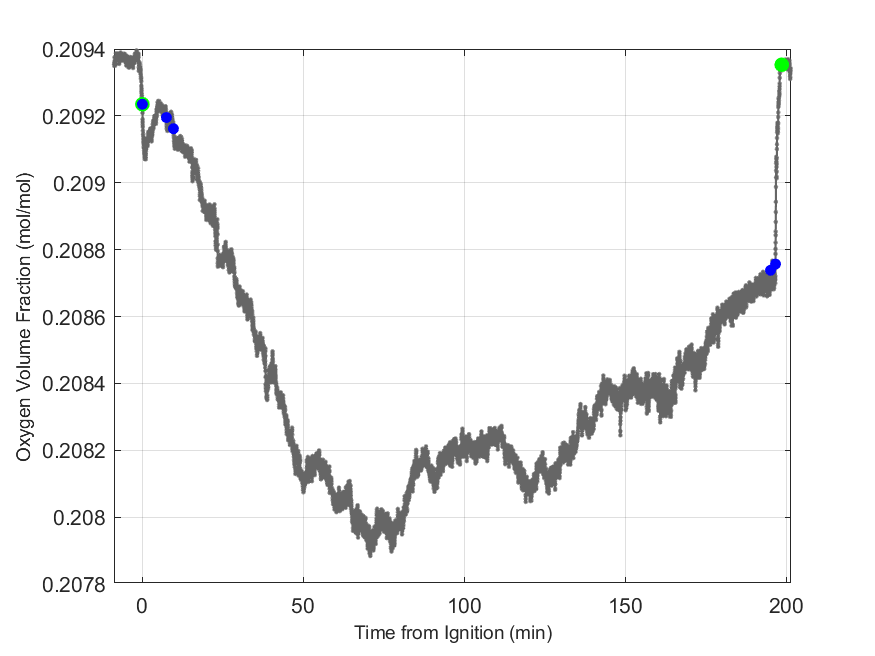
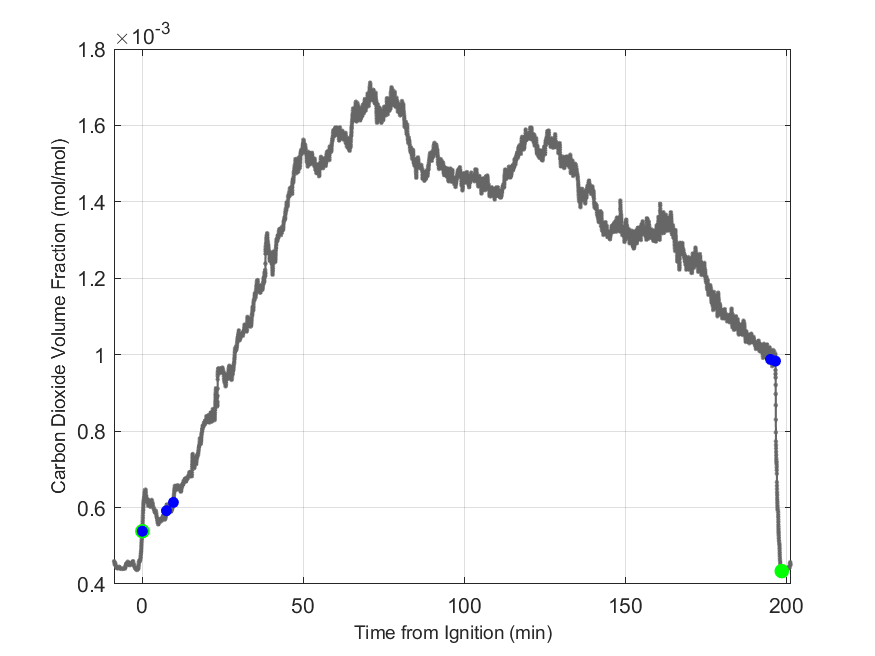
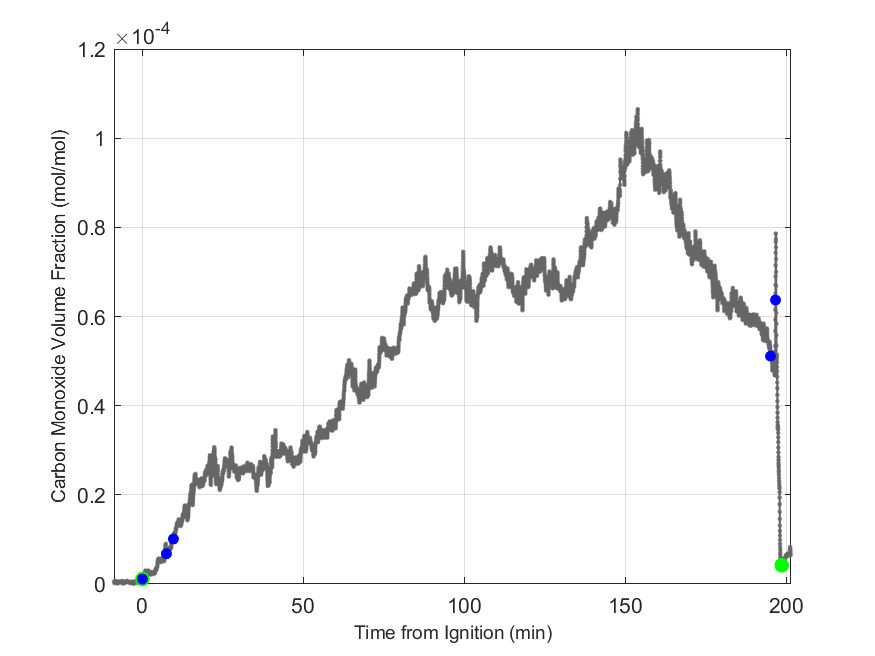
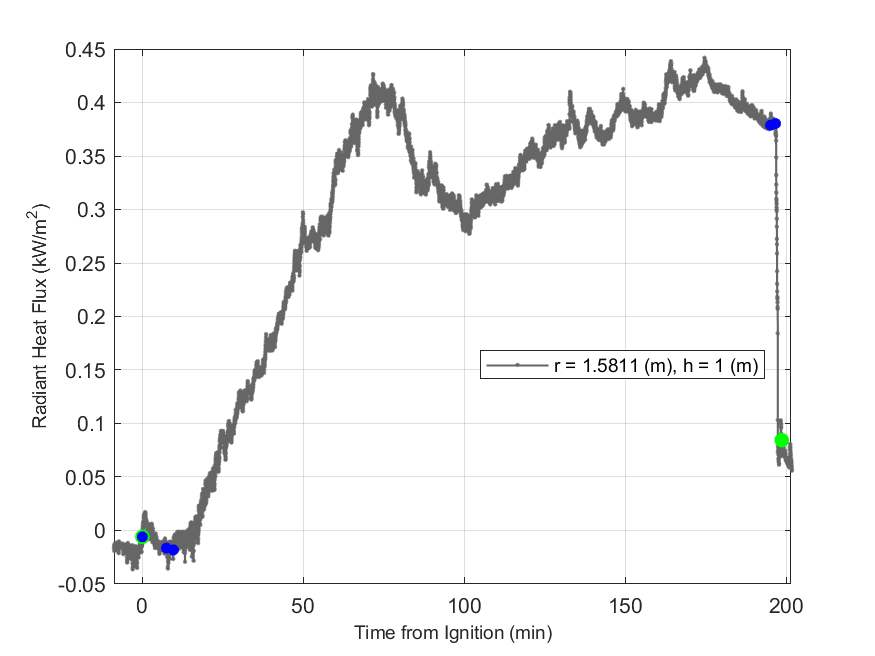
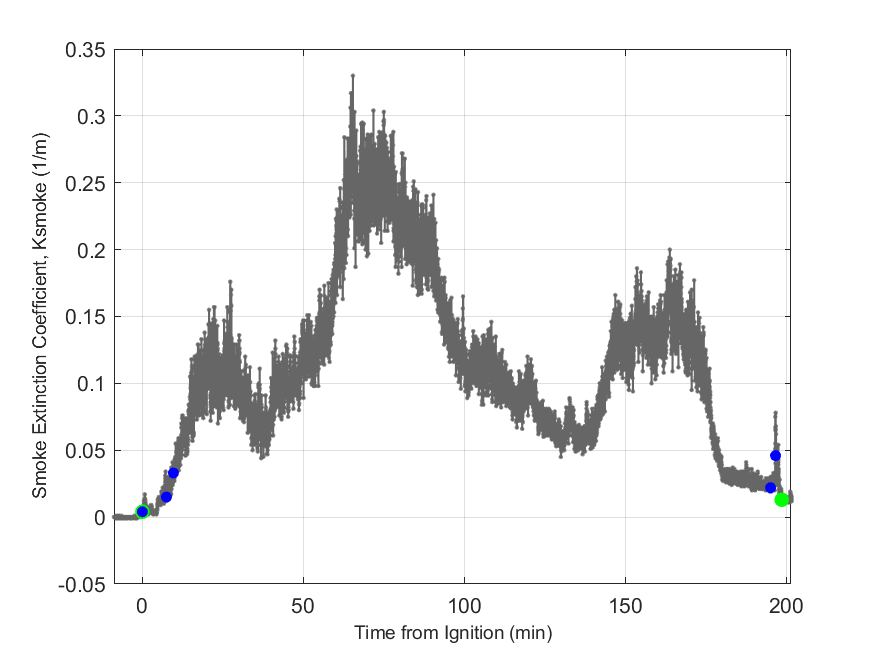
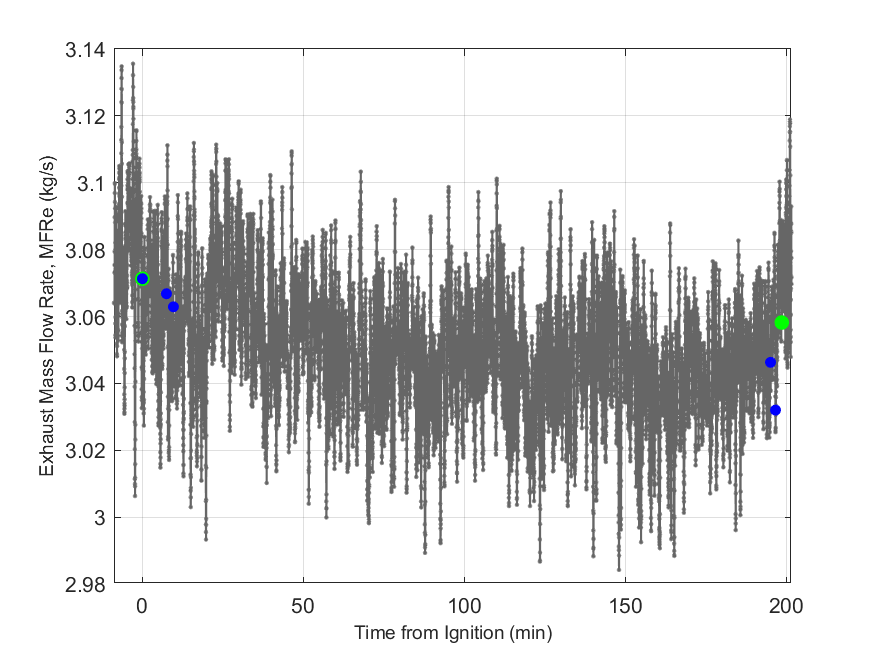
Table 5. Supplemental Data Plots
Bryant, R. and Bundy, M. The NIST 20 MW Calorimetry Measurement System for Large-Fire Research, Technical Note (NIST TN) 2077, 2019
https://doi.org/10.6028/NIST.TN.2077
NIST Fire Calorimetry Database (FCD)
https://doi.org/10.18434/mds2-2314