
Official websites use .gov
A .gov website belongs to an official government organization in the United States.
Secure .gov websites use HTTPS
A lock (
) or https:// means you’ve safely connected to the .gov website. Share sensitive information only on official, secure websites.
Visualization of Biological Images: Multimedia
This page contains images related to the Visualization of Biological Images project.
 | 41 slices of the Cornell data set SL0059: an isosurface at -300 Hounsfield units. |
 | 41 slices of the Cornell data set SL0059: volume visualization. |
 | A single slice of CT data containing a clinical tumor in the blue box and a synthetic model in the red box. |
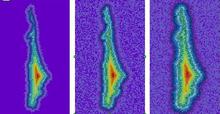
| The same cell imaged under different imaging conditions show a range of edge quality. |
Created September 28, 2010, Updated April 3, 2025