
Official websites use .gov
A .gov website belongs to an official government organization in the United States.
Secure .gov websites use HTTPS
A lock (
) or https:// means you’ve safely connected to the .gov website. Share sensitive information only on official, secure websites.
NGQC_15m_50kgs_R2
| Name | NGQC_15m_50kgs_R2
|
|---|---|
| Date | |
| Description | Test newly installed smoke meter on 15 m hood 2.4 m duct section of 20 MW calorimeter |
| Specimen | Tube Burner
|
| Ignition | electric spark
|
| Project ID (s) | |
| Test Director | Bundy
|
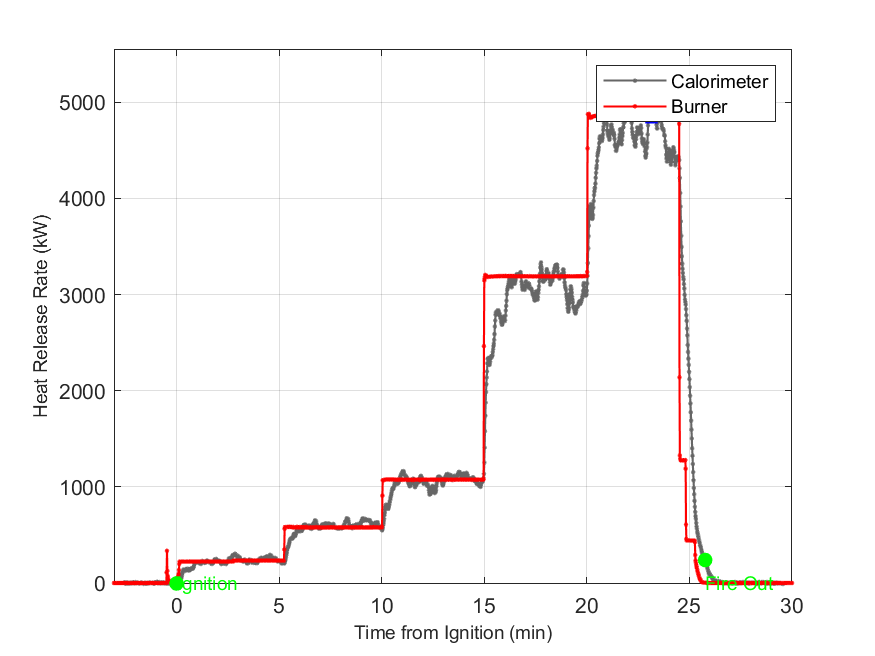
Timelapse Video with Heat Release Rate Plot
| Measurement | Value | Uc | Unit |
|---|---|---|---|
| Peak Heat Release Rate, PHRR
|
5,049
|
258
|
kW
|
| Time to Peak Heat Release Rate
|
23.13
|
0.07
|
min
|
| Total Heat Released, THR
|
2,800
|
147
|
MJ
|
| Gas Burner Total Heat Released, NGTHR
|
2,866
|
41
|
MJ
|
| Heat Release Quality Confirmation, HRQC
|
1.008
|
0.055
|
MJ/MJ
|
| Net Specimen Mass (gravimetric), NM = Mi-Mf
|
Not measured | - | kg
|
| Total Fuel Mass Burned, TFM = THR / HOCf
|
56.0
|
3.4
|
kg
|
| Net Effective Heat of Combustion = THR / NM
|
Not measured | - | MJ/kg
|
| O2 Yield = O2 Consumed / TFM
|
3.63
|
0.25
|
kg/kg
|
| CO2 Yield = CO2 Generated / TFM
|
2.78
|
0.20
|
kg/kg
|
| CO Yield = CO Generated / TFM
|
0.00062
|
0.00031
|
kg/kg
|
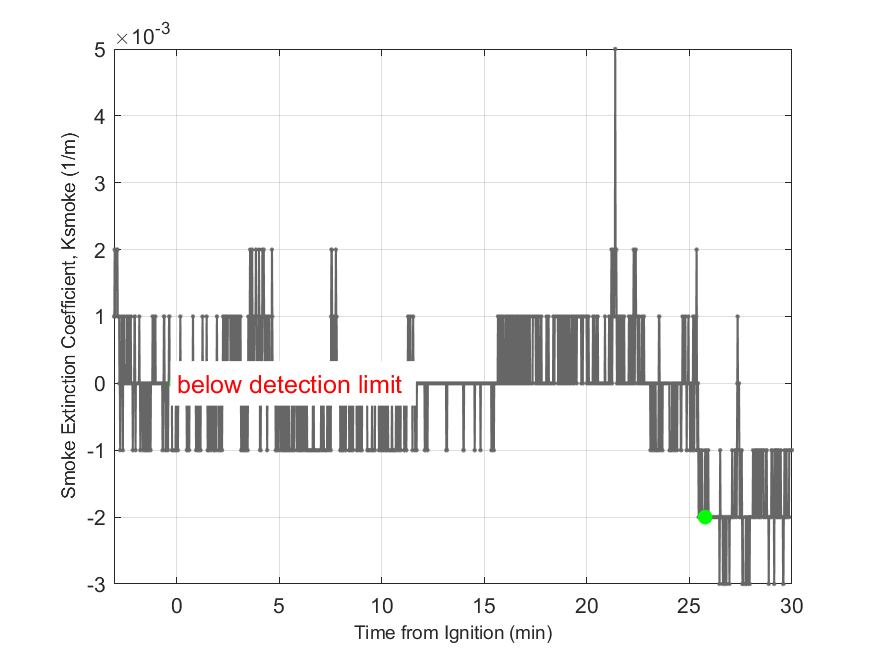
| Soot Yield = Soot Generated / TFM
|
below detection limit
|
0.00024
|
kg/kg
|
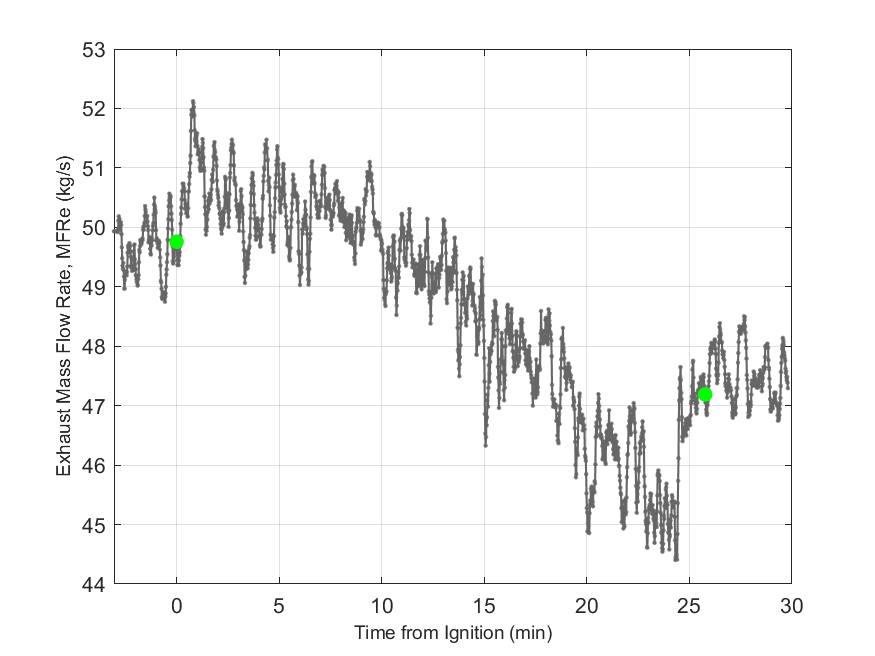
| Baseline Hood Exhaust Flow
|
49.5
|
1.5
|
kg/s
|
| Test Duration = Time(Fire Out) - Time(Ignition)
|
25.77
|
0.03
|
min
|
Uc = Combined Expanded Uncertainty with 95% confidence level
| Parameter | Value | Uc | Unit |
|---|---|---|---|
| Fuel Type
|
Natural Gas
|
- | - |
| Hood Size
|
15
|
- | m
|
| Effective Duct Diameter
|
2.424
|
0.009
|
m
|
| Exhaust Flow Correction Factor
|
1.042
|
0.032
|
- |
| Net Heat of Combustion (per unit mass O2), Ef
|
12.54
|
0.50
|
MJ/kg
|
| Net Heat of Combustion(per unit mass fuel), HOCf
|
50.00
|
1.50
|
MJ/kg
|
| Initial Specimen Mass, Mi (gravimetric)
|
Not measured | - | kg
|
| Final Specimen Mass, Mf (gravimetric)
|
Not measured | - | kg
|
| Event | Time (min) | Description | Video Snapshot Image |
|---|---|---|---|
| 1
|
0.00
|
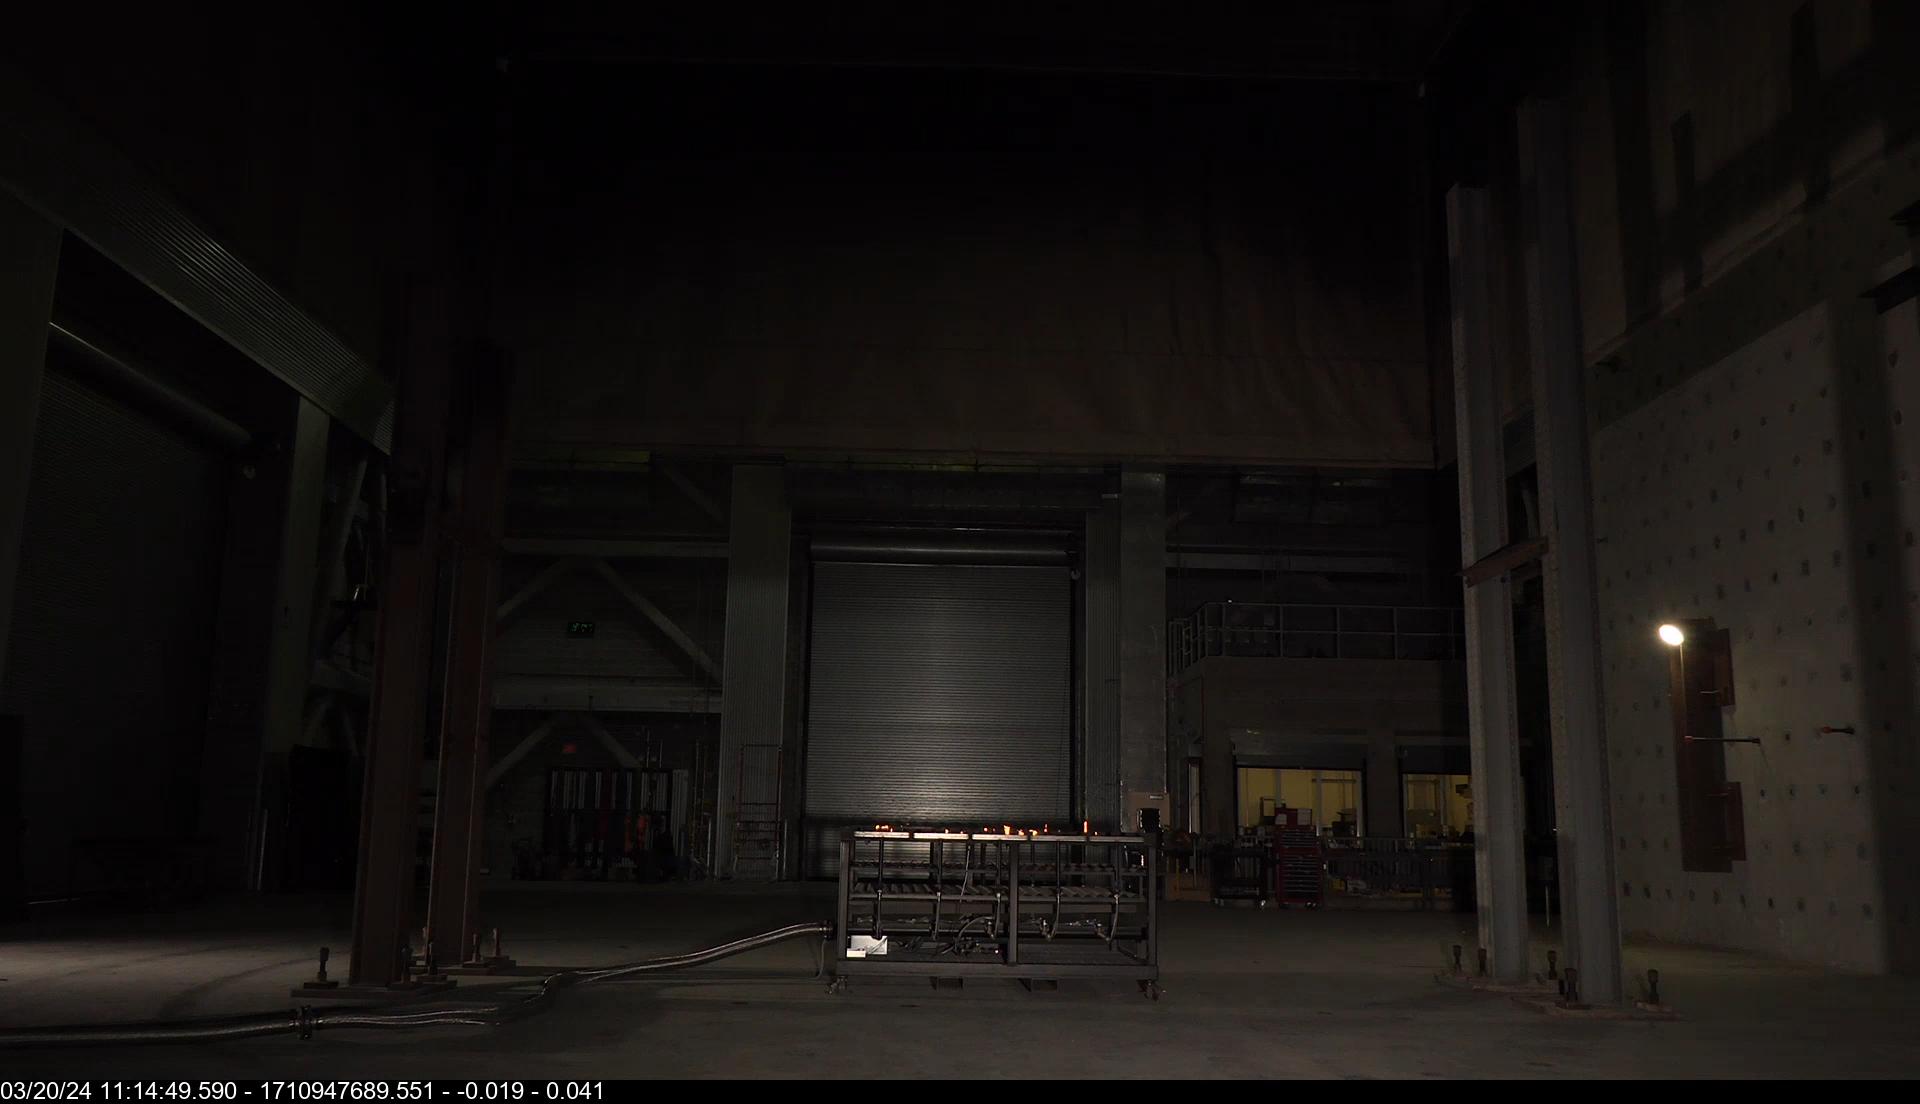
Ignition
|
|
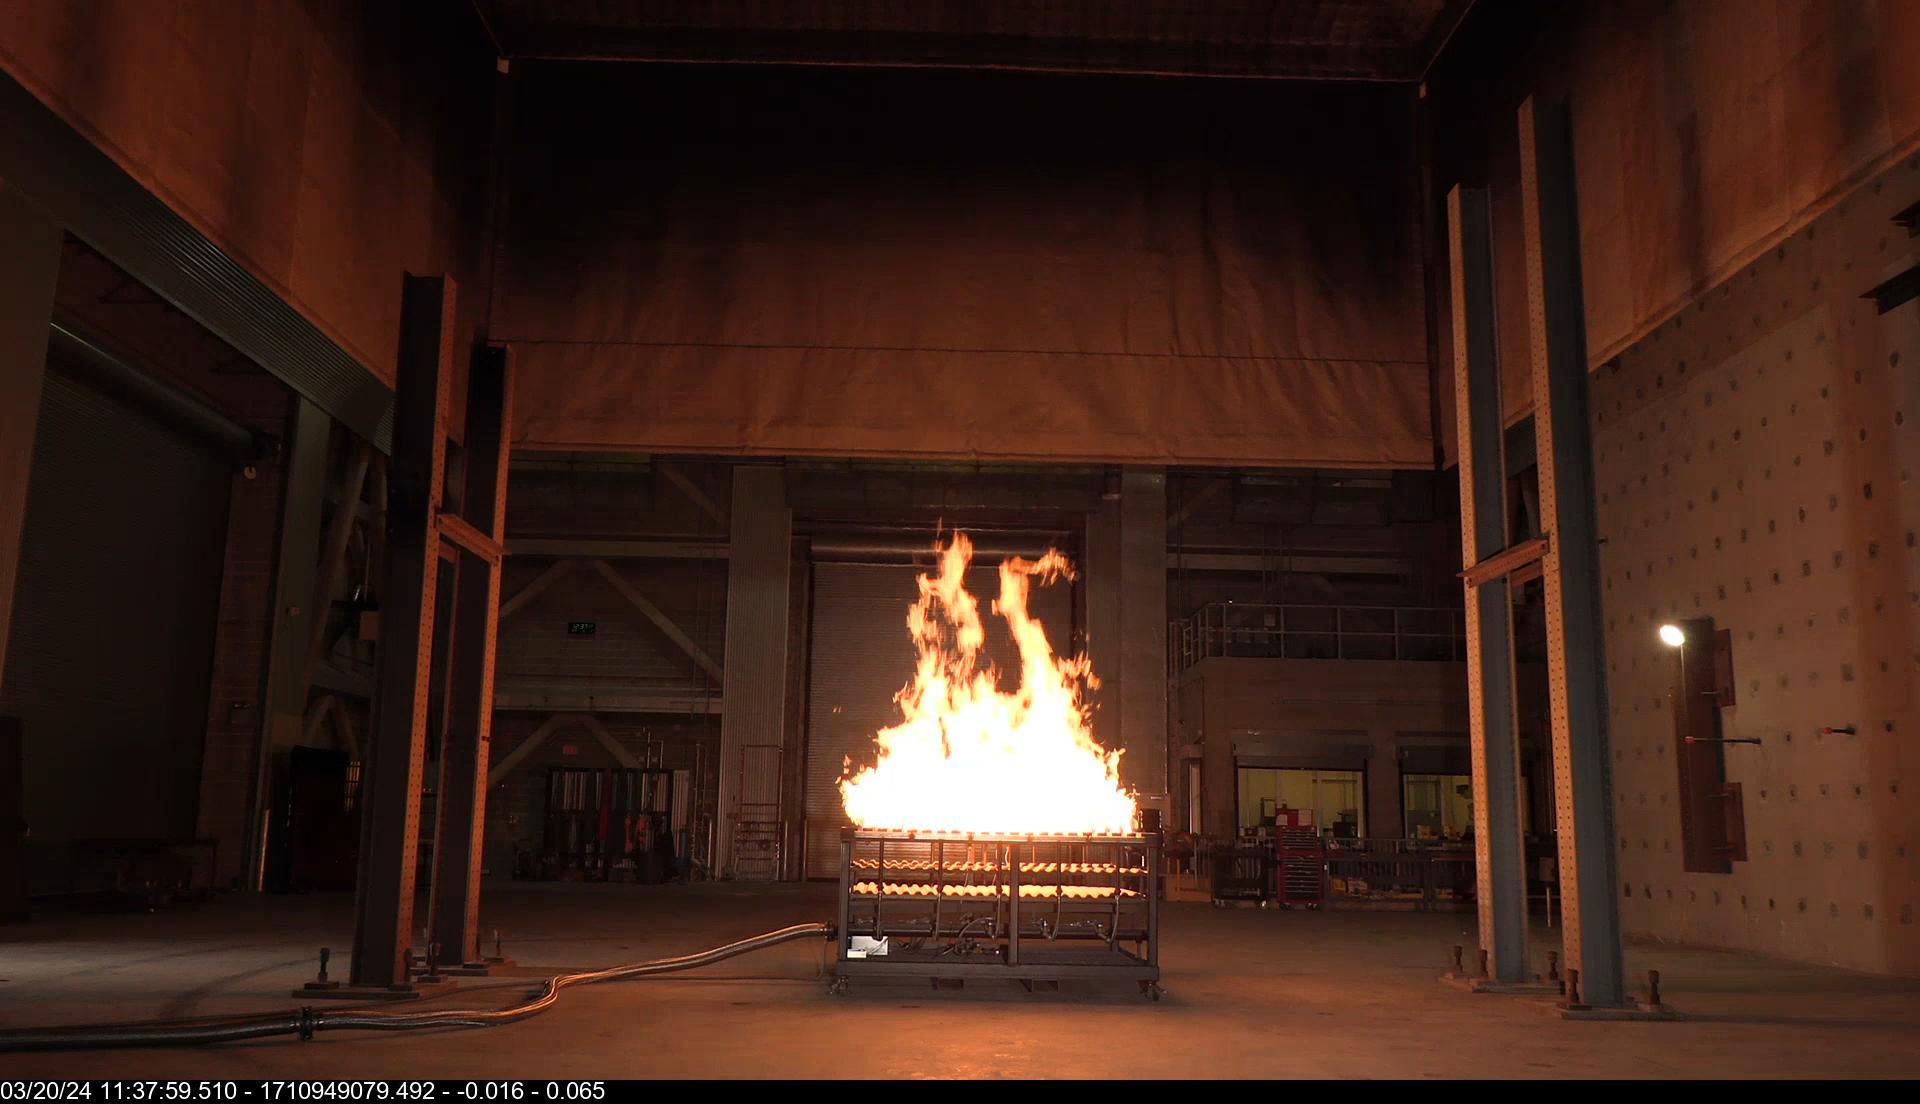
| peak
|
23.13
|
Peak HRR
|
|
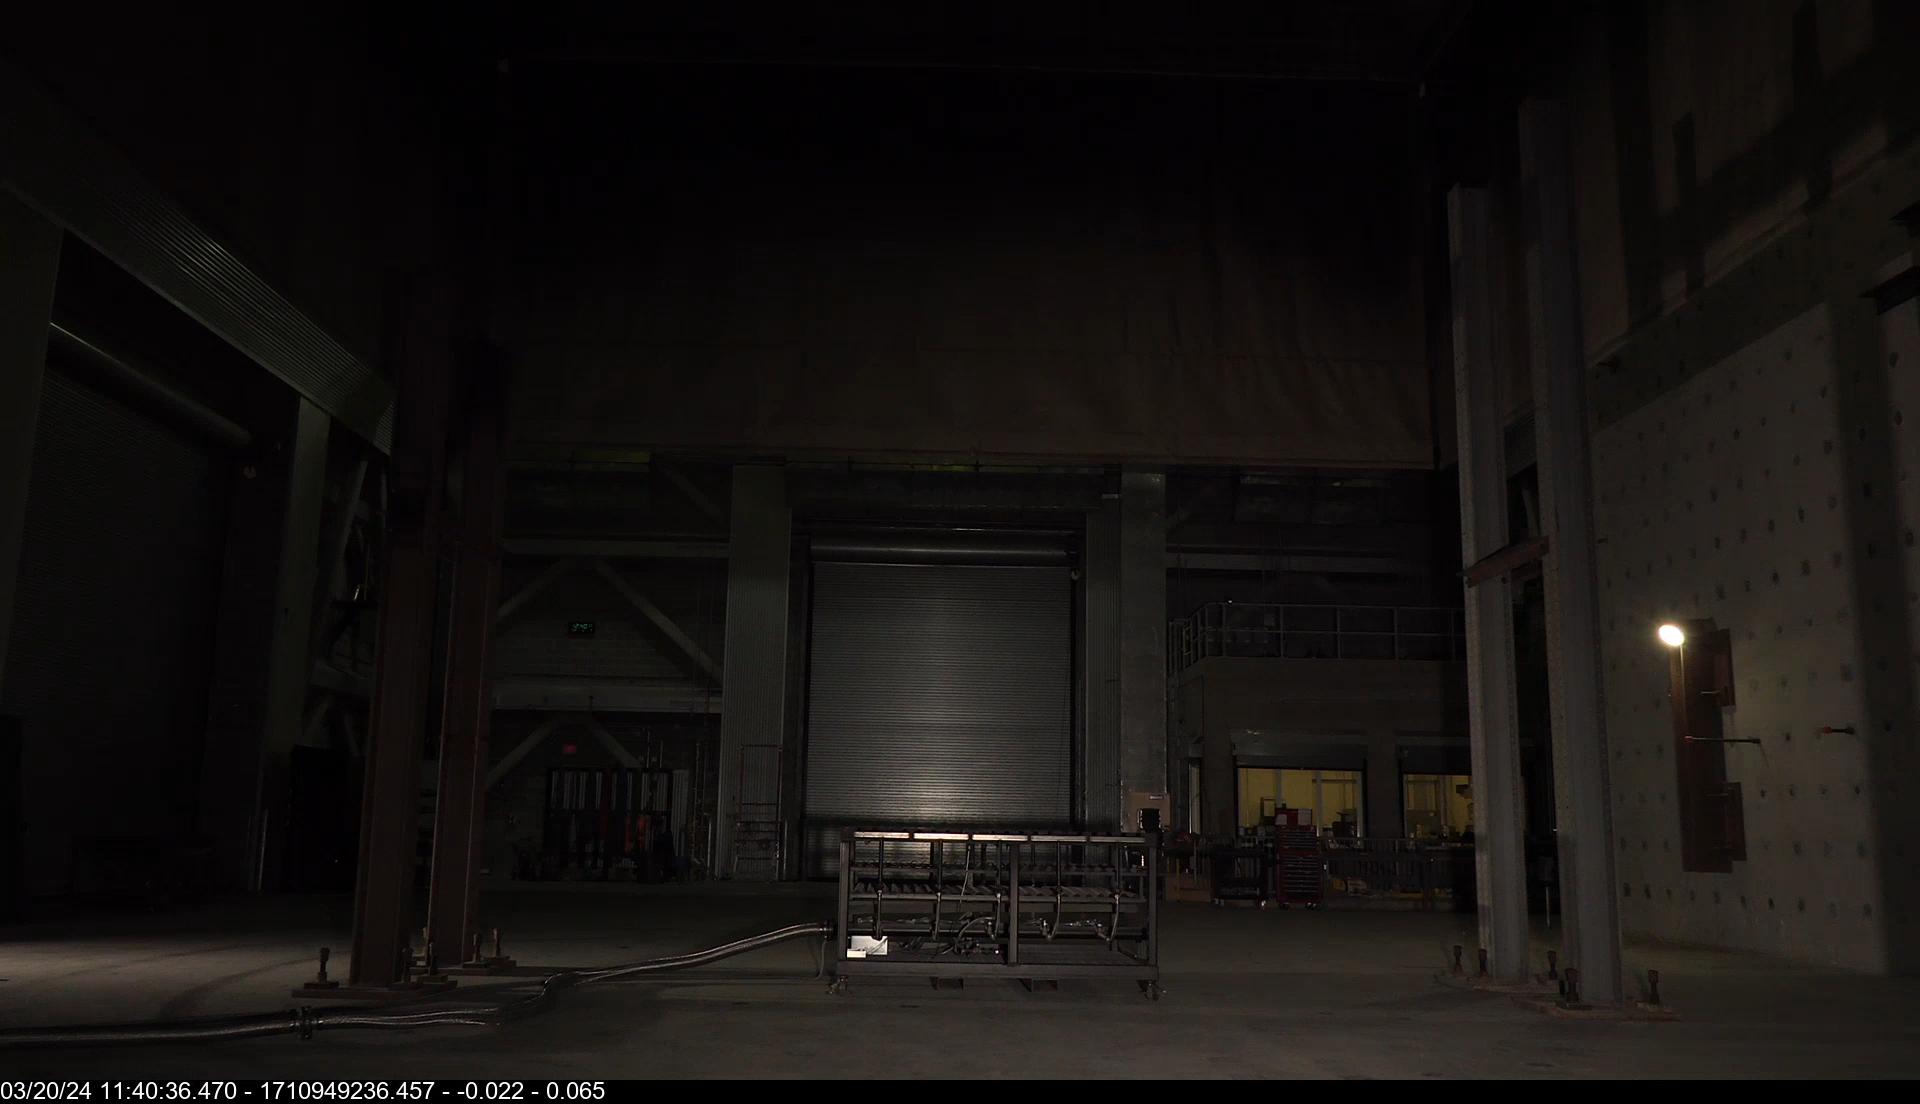
| 2
|
25.77
|
Fire Out
|
|
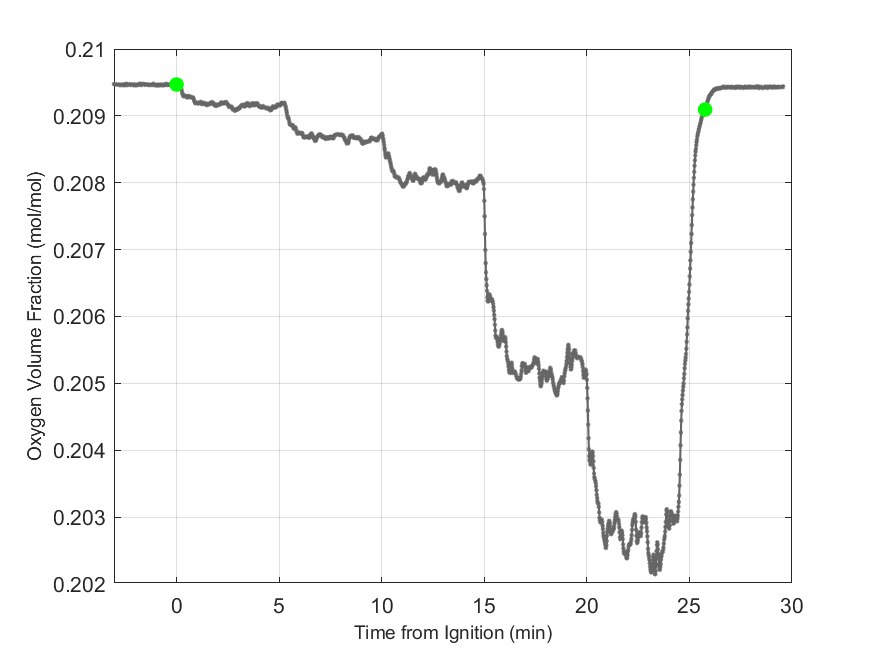
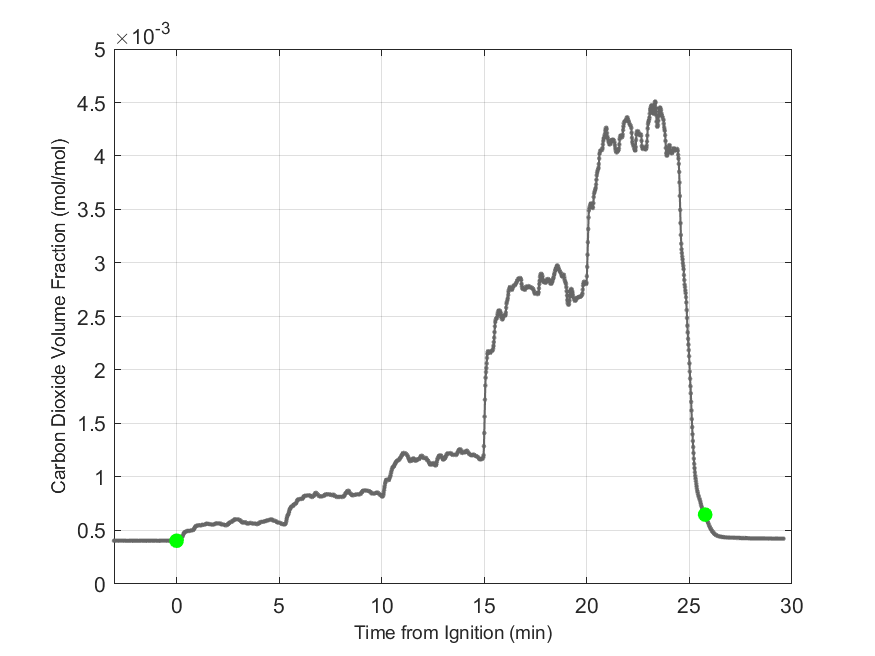
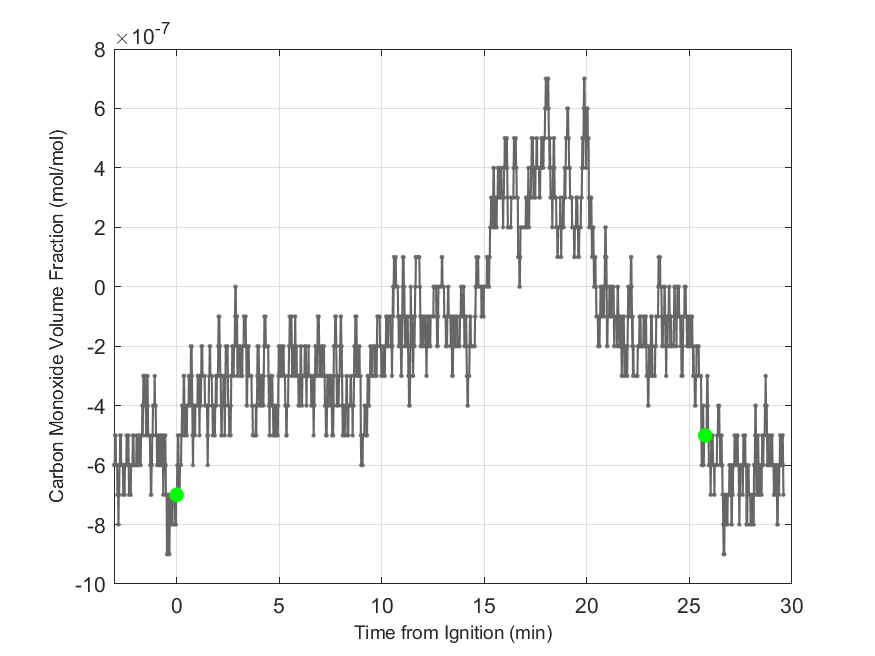
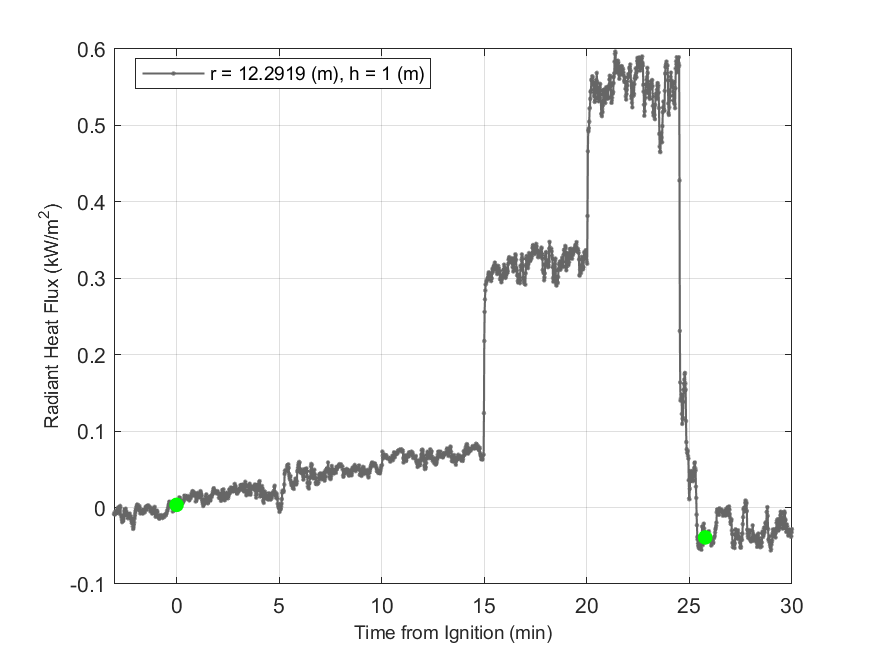
Table 5. Supplemental Data Plots
Bryant, R. and Bundy, M. The NIST 20 MW Calorimetry Measurement System for Large-Fire Research, Technical Note (NIST TN) 2077, 2019
https://doi.org/10.6028/NIST.TN.2077
NIST Fire Calorimetry Database (FCD)
https://doi.org/10.18434/mds2-2314