
Official websites use .gov
A .gov website belongs to an official government organization in the United States.
Secure .gov websites use HTTPS
A lock (
) or https:// means you’ve safely connected to the .gov website. Share sensitive information only on official, secure websites.
Taking Measure
Just a Standard Blog
Listening to the Data: How a NIST Tool Helps Labs Worldwide Harmonize Measurements
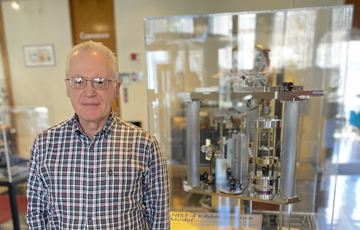
NIST researcher and Fellow Antonio Possolo helped estimate the value of the Planck constant. The Kibble balance, pictured here, uses the numerical value of Planck constant to define the kilogram.
If a traveler from Germany goes to Vietnam and falls ill, the results of their blood test there should be as meaningful as if the test were taken at home. If a Japanese airliner lands in Argentina and needs a part, that part needs to be installed using properly calibrated tools.
Commerce, science, engineering, medicine and most other human activities depend on measurements. In a global economy, measurements need to be reliably comparable across the world.
But how do we ensure that actually happens?
National metrology institutes — NIST and equivalent institutes in other countries — participate often in rigorous, challenging comparisons of their measurement capabilities. Each laboratory measures the same material or piece of equipment, generally following the same steps, and then the labs compare results. These are called key comparisons. If the results are not mutually consistent, then it’s a learning opportunity for the participants to improve their measurement procedures.
Agreeing to the Rules
The question for researchers is how best to combine everyone’s results into a consensus value. Let’s say we’re measuring the concentration of lead in wine. The participating labs receive vials of wine and measure them according to a specified protocol. Ideally, the consensus value for the concentration of lead in the wine is expected to be closer to the truth than individual measurements are.
Although it doesn’t always work out that way, that’s the goal of these types of studies.
The measurement results that are combined into a consensus value each include a measured value (how much we think there is of whatever is being measured) and an evaluation of the measurement uncertainty.
Because measurements aren’t perfect, measurement uncertainty is the doubt that remains about the true value of a quantity after making a measurement; it’s the “give or take” margin.
Uncertainty is like fog. If you’re driving and there’s a little fog, you may be on higher alert to your surroundings to make sure you can drive safely. But if there’s so much fog you can barely see, your drive is much more dangerous. Uncertainty is like a fog that surrounds the true value you are after. The greater the uncertainty, the greater the doubt about what the truth really is.
So, if I asked you to determine the mass of the beans in a bag of coffee beans, you might reach the conclusion that it is 1,000 grams, give or take 15 grams. The 1,000 grams is how much we measured, and the 15 grams is the measurement uncertainty. This means that the true mass of the coffee beans is likely to be between 985 grams and 1,015 grams.
The obvious answer to the question of how to come up with a consensus value may be to average the measured values from the different labs. But this isn’t necessarily the best answer because different measurement results may have different uncertainties, and some measurement results may be very far from most of the others. Outlying measurements often call for reexamination and may require special treatment.
Very often, participating labs disagree on how best to blend the results from a key comparison into a consensus value. They also sometimes don’t agree on how the individual results should be compared with the consensus value and with one another.
Such disagreement can create considerable difficulties and delays. Imagine a sport where before every game, the participants had to negotiate the rules! It’s unwieldy.
That’s why NIST statisticians and scientists created a web-based tool called the NIST Decision Tree. Organizers of an interlaboratory study can use the tool to determine how to best handle the study’s data. The tool offers suggestions, but the scientists are always in the driver’s seat to choose the data analysis procedure that they believe fits their data and best serves the purpose of their study.
The tool asks researchers a few simple questions about their data. Based on the answers, the NIST Decision Tree makes a recommendation for how that data should be modeled and analyzed. To go back to the sports analogy, we suggest rules for the participants in the game to agree to.
Real-World Uses for the NIST Decision Tree
Let’s say we’re doing a study where different laboratories measure how much arsenic there is in a sample of rice flour. That’s a measurement that we need to get right because of the stakes for people’s health.
A laboratory leading a study would prepare a batch of the flour, fill vials with it, seal the vials and ship them to participants. Before they are shipped, the organizing laboratory would run its own preliminary study to verify that the samples of flour in the vials have essentially the same amount of arsenic. The lab would measure how many micrograms of arsenic per gram of flour, for example.
The labs participating in the study would receive a protocol on how to handle the flour and, possibly, suggested measurement steps to determine the amount of arsenic in it. In other cases, the participating labs choose their own measurement methods.

Once the measurements have been completed, the labs have to agree on how their measurement results will be compared. This is often a contentious topic that takes time and resources. That’s where the NIST Decision Tree comes in.
A key part of this process is selecting the best statistical model to use to analyze the data. I call such identification “listening to the data.” A good statistical model should be respectful of the data and of the people who have meticulously planned and conducted experiments to obtain it.
The NIST Decision Tree has been used in quite a few studies so far, including in key comparisons in chemistry and in temperature measurements organized by subcommittees of the International Committee for Weights and Measures.
We’re now working with oceanographers to determine how the NIST Decision Tree can be used in an international cooperative effort to study changing ocean and environmental conditions, known as GEOTRACES.
Using Statistics Across the Disciplines
As NIST’s chief statistician, and in my whole life as a statistician, I have been coaxing the data to reveal how it should be analyzed. Data conveys relevant information about nature and about industrial, technological and scientific facts and processes — if we know how to listen to it.
About 40 years ago, while I was a graduate student at Yale, I spent two summers as a research assistant to Felix Chayes, at the Geophysical Laboratory of the Carnegie Institution of Washington.
One day, he told me: “Let’s go visit my friend Churchill Eisenhart at NIST in Gaithersburg.”
There were no security controls back then, so we just drove in and walked into a cavernous building where I had the honor of meeting this great man. He gave me a reprint of one of his papers. I could not even imagine then that many years later, I would become his successor both as chief of the Statistical Engineering Division (which Eisenhart founded in 1948) and as a NIST Fellow.
Today, I get to collaborate with scientists and engineers working in many different disciplines at NIST. I work to understand the problems they’re researching, so I can help them model and analyze data in ways that add value to their research. I spend much of my time supporting NIST’s measurement services, including the development of standard reference materials that we produce to help labs and manufacturers calibrate their instruments and verify their accuracy.
From time to time, I support projects outside NIST. One of the most memorable experiences of my career was participating in the national response to the Deepwater Horizon oil spill in the Gulf of Mexico in 2010.
I worked closely with colleagues from other government agencies to develop a web-based tool that the U.S. Coast Guard used to estimate the daily amount of spilled oil still polluting the waters of the Gulf and its shoreline.
I was also honored to testify on behalf of the United States in federal court in 2012 in a case related to the oil spill, against multiple corporate defendants.
I try to learn something new every day, even if it is only a little something. A few days ago, I discovered a free open-source mathematics software system. I’ve already used it in some of my research.
At the end of every day, I always ask myself, “What did I learn today?” Even after decades of doing this work, there’s always something new to learn.


One of the best professionals I have had the honor to meet in this metrology world! I have learned a lot reading Antonio's papers, attending his workshops, listening to his advices, and using the NIST Statistical Tools including the NIST Decision Tree. Thank you very much for everything!