
Official websites use .gov
A .gov website belongs to an official government organization in the United States.
Secure .gov websites use HTTPS
A lock (
) or https:// means you’ve safely connected to the .gov website. Share sensitive information only on official, secure websites.
Summary
Biomolecular assembly allows the integration of nanoscale components into functional nanostructures. The Nanostructure Fabrication and Measurement Group develops innovative experimental measurements and theoretical models to develop a quantitative understanding of DNA assembly processes, enabling higher yield and performance.
Description
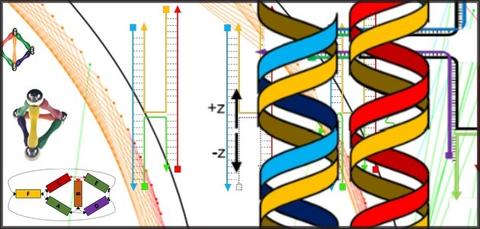
The integration of new materials or components into the design and production of diverse nanotechnologies, ranging from electronic devices to therapeutic particles, requires a quantitative understanding of process–structure–property relationships, as well as interactions with other entities in the operating environments. This is just as true for biomolecular nanofabrication as it is for silicon. DNA nanotechnology employs the programmability of Watson-Crick base pairing to assemble two-dimensional and three-dimensional shapes. These complex shapes are complete with attachment points that cover the structure in precise locations to enable higher-order assembly or incorporation of solid-state objects such as gold nanoparticles, like a macromolecular electronic breadboard. DNA origami is one of the most promising routes to bottom-up biomolecular assembly, employing a long single-stranded scaffold that folds as short staple strands unite distant regions on the scaffold by hybridization. However, such self-assembling systems, if left undirected, can explore an enormous configurational space, potentially leading to large reductions of yield or undesired interactions amongst components or other objects such as within the body. In addition, the versatility of origami allows for a plethora of design choices leading to almost identical structures that have vastly different thermal and kinetic properties. In other words, both assembly yield and functional performance vary significantly for nominally identical inputs.
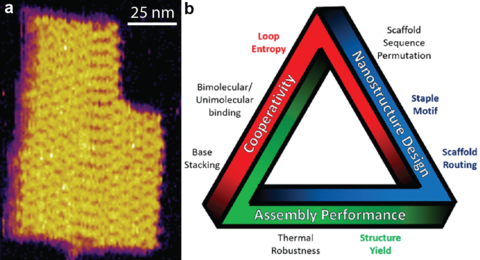
To address this challenge and set the conceptual and practical foundations to high yield, tailorable assembly, we are developing the measurement, analysis, and theoretical tools to quantitatively understand the DNA origami folding process. This process is cooperative, meaning that many folds can either reinforce assembly or compete with each other or with intrinsic biomolecular structure. We designed and implemented a FRET-based reporting system permitting the first ever delineation of several factors influencing assembly yield. This reporting system goes hand in hand with novel techniques of data analysis that provide accurate melting temperatures and thermodynamic parameters, as well as corresponding uncertainties. Other notable results include the incorporation of DNA-binding proteins to extend the length scales of assembly, working with industry stakeholders to improve assembly yield, and publishing a tutorial to transfer working knowledge to the external community. Our current research aims to form nanostructures for photonic devices, bioelectronic interfaces, and nanopore systems, as well as extending the measurement approach to more complex assemblies.
Highlights
Highlight: NIST publishes a beginner’s guide to DNA origami
The process of DNA origami involves folding long strands of DNA to assemble nanostructures. Pioneered at the California Institute of Technology in 2006, DNA origami has attracted hundreds of new researchers over the past decade, eager to make sensors and containers to detect and treat disease in the human body, assess the environmental impact of pollutants, and assist in a host of other biological applications. Although the principles of DNA origami are straightforward, the tools and methods for designing new structures are not always easy to grasp and have not been well documented. In addition, scientists new to the method have had no single reference they could turn to for the most efficient way of building DNA structures and how to avoid pitfalls that could waste months or even years of research. To address this issue, we compiled the first detailed tutorial on the technique. This comprehensive report, published in the Journal of Research of the National Institute of Standards and Technology, provides a step-by-step guide to designing DNA origami nanostructures, using state-of-the-art tools.
- Majikes, J. M. and Liddle, J. A., DNA Origami Design: A How-To Tutorial, J. Res. Natl. Inst. Stand. Technol. 126 (2021)
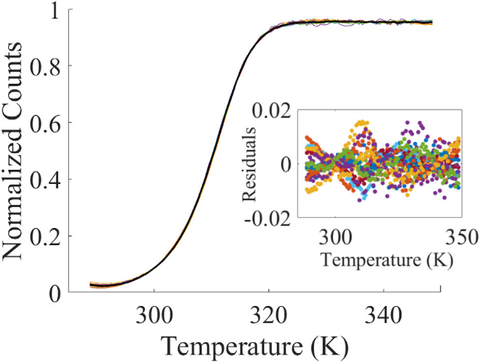
Highlight: Making the DNA melt curve more accurate
To enhance the process of DNA origami assembly, we have improved the accuracy of a measurement of how heat affects the stability of assembled DNA nanostructures. To function reliably, these structures must be carefully assembled. But the hydrogen bonds that bind single strands of DNA together to form the double helix depend on both temperature and their local environment. To determine how different strands of DNA react to temperature changes, researchers rely on a series of measurements that form a DNA melt curve. The curve reveals the temperature at which half the strand has melted, or unraveled, and also shows the amount of heat the strands must absorb to raise their temperature by one degree Celsius. By revealing these and other thermal properties of the strands, the curve informs the design of durable and complex structures from DNA. As important as the DNA melt curve is, there remains a long-standing problem in accurately measuring it. Because of background effects and unknown sources of variability, identical DNA samples will have different melt curves, limiting the ability to extract meaningful information. To solve this problem, we designed a novel mathematical algorithm, based on an affine transformation, that automatically accounts for these unknown effects, allowing scientists to reap the full benefits of the melt curve. This approach may also be applied to improving the accuracy of medical diagnostics that rely on melt curve measurements.
- Patrone, P. N., Kearsley, A. J., Majikes, J. M., & Liddle, J.A., Analysis and Uncertainty Quantification of DNA Fluorescence Melt Data: Applications of Affine Transformations, Anal. Biochem. 607 (2020)