Official websites use .gov
A .gov website belongs to an official government organization in the United States.
Secure .gov websites use HTTPS
A lock (
) or https:// means you’ve safely connected to the .gov website. Share sensitive information only on official, secure websites.
Basic Metrology: Comparison of NIST-1 and NIST-3 Standard Ampoules
Summary
Since the 1950s, the NIST Radioactivity Group has employed standardized 5 mL borosilicate glass ampoules for ionization chamber measurements and high-resolution photonic emission spectrometry. These ampoules have been and are used for dissemination of SRMs and for other calibration applications. In 2019, the fourth generation of such standardized ampoules began to be deployed. To ensure consistency, over decades, in secondary calibrations via ionization chamber measurements and gamma spectrometry, it is critical to compare the relative radiative response for radioactive solutions in the 1976-era NIST-1 ampoules to that in the replacement 2019 NIST-3 ampoules.
Description
Exhaustive comparisons of the NIST-1 and NIST-3 ampoules are underway. Ion chamber evaluations have been completed for 99Mo, 133Ba, 241Am, 201Tl, and 67Ga. HPGe gamma-ray spectrometry evaluations have been completed for 99Mo, 133Ba, 241Am, 201Tl, and 67Ga. Many more evaluations are in the design / planning stages. In future work, the findings will be investigated in terms of chemical composition of the ampoules and Monte Carlo modeling.
The NIST-3/NIST-1 comparative response for ionization chamber measurements ranged from 1.00390 ± 0.00042 for 99Mo in Chamber A to 1.0252 ± 0.0022 and 1.0243 ±0.0038 for 201Tl in Chambers A and B, respectively. The uncertainties cited here are computed 95 % confidence intervals.
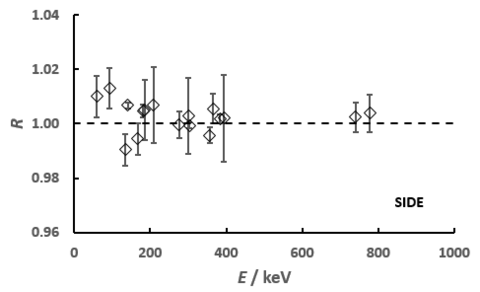
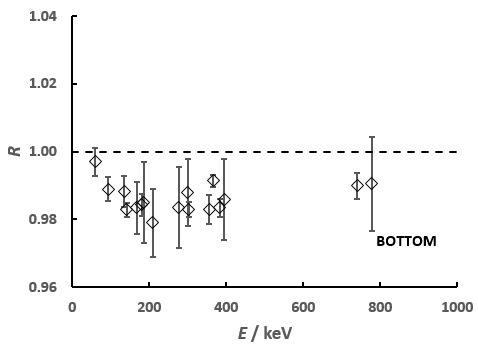
The photonic emission spectrometry results are shown in the figure below. It provides the comparative effect of the NIST-3 to NIST-1 ampoules, in terms of the efficiency ratio R for specific gamma rays as a function of the energy E in keV. The uncertainty bars on each ratio is an assumed 95 % confidence interval using a coverage factor of k = 2. The lower trace is that for a solid angle geometry where the ampoule is located above the detector such that the attenuation occurs through the ampoule bottom. The upper trace is for the condition where the detector views the ampoule through the side of the ampoule’s body wall.