
Official websites use .gov
A .gov website belongs to an official government organization in the United States.
Secure .gov websites use HTTPS
A lock (
) or https:// means you’ve safely connected to the .gov website. Share sensitive information only on official, secure websites.
Semiconductor Data Correlations
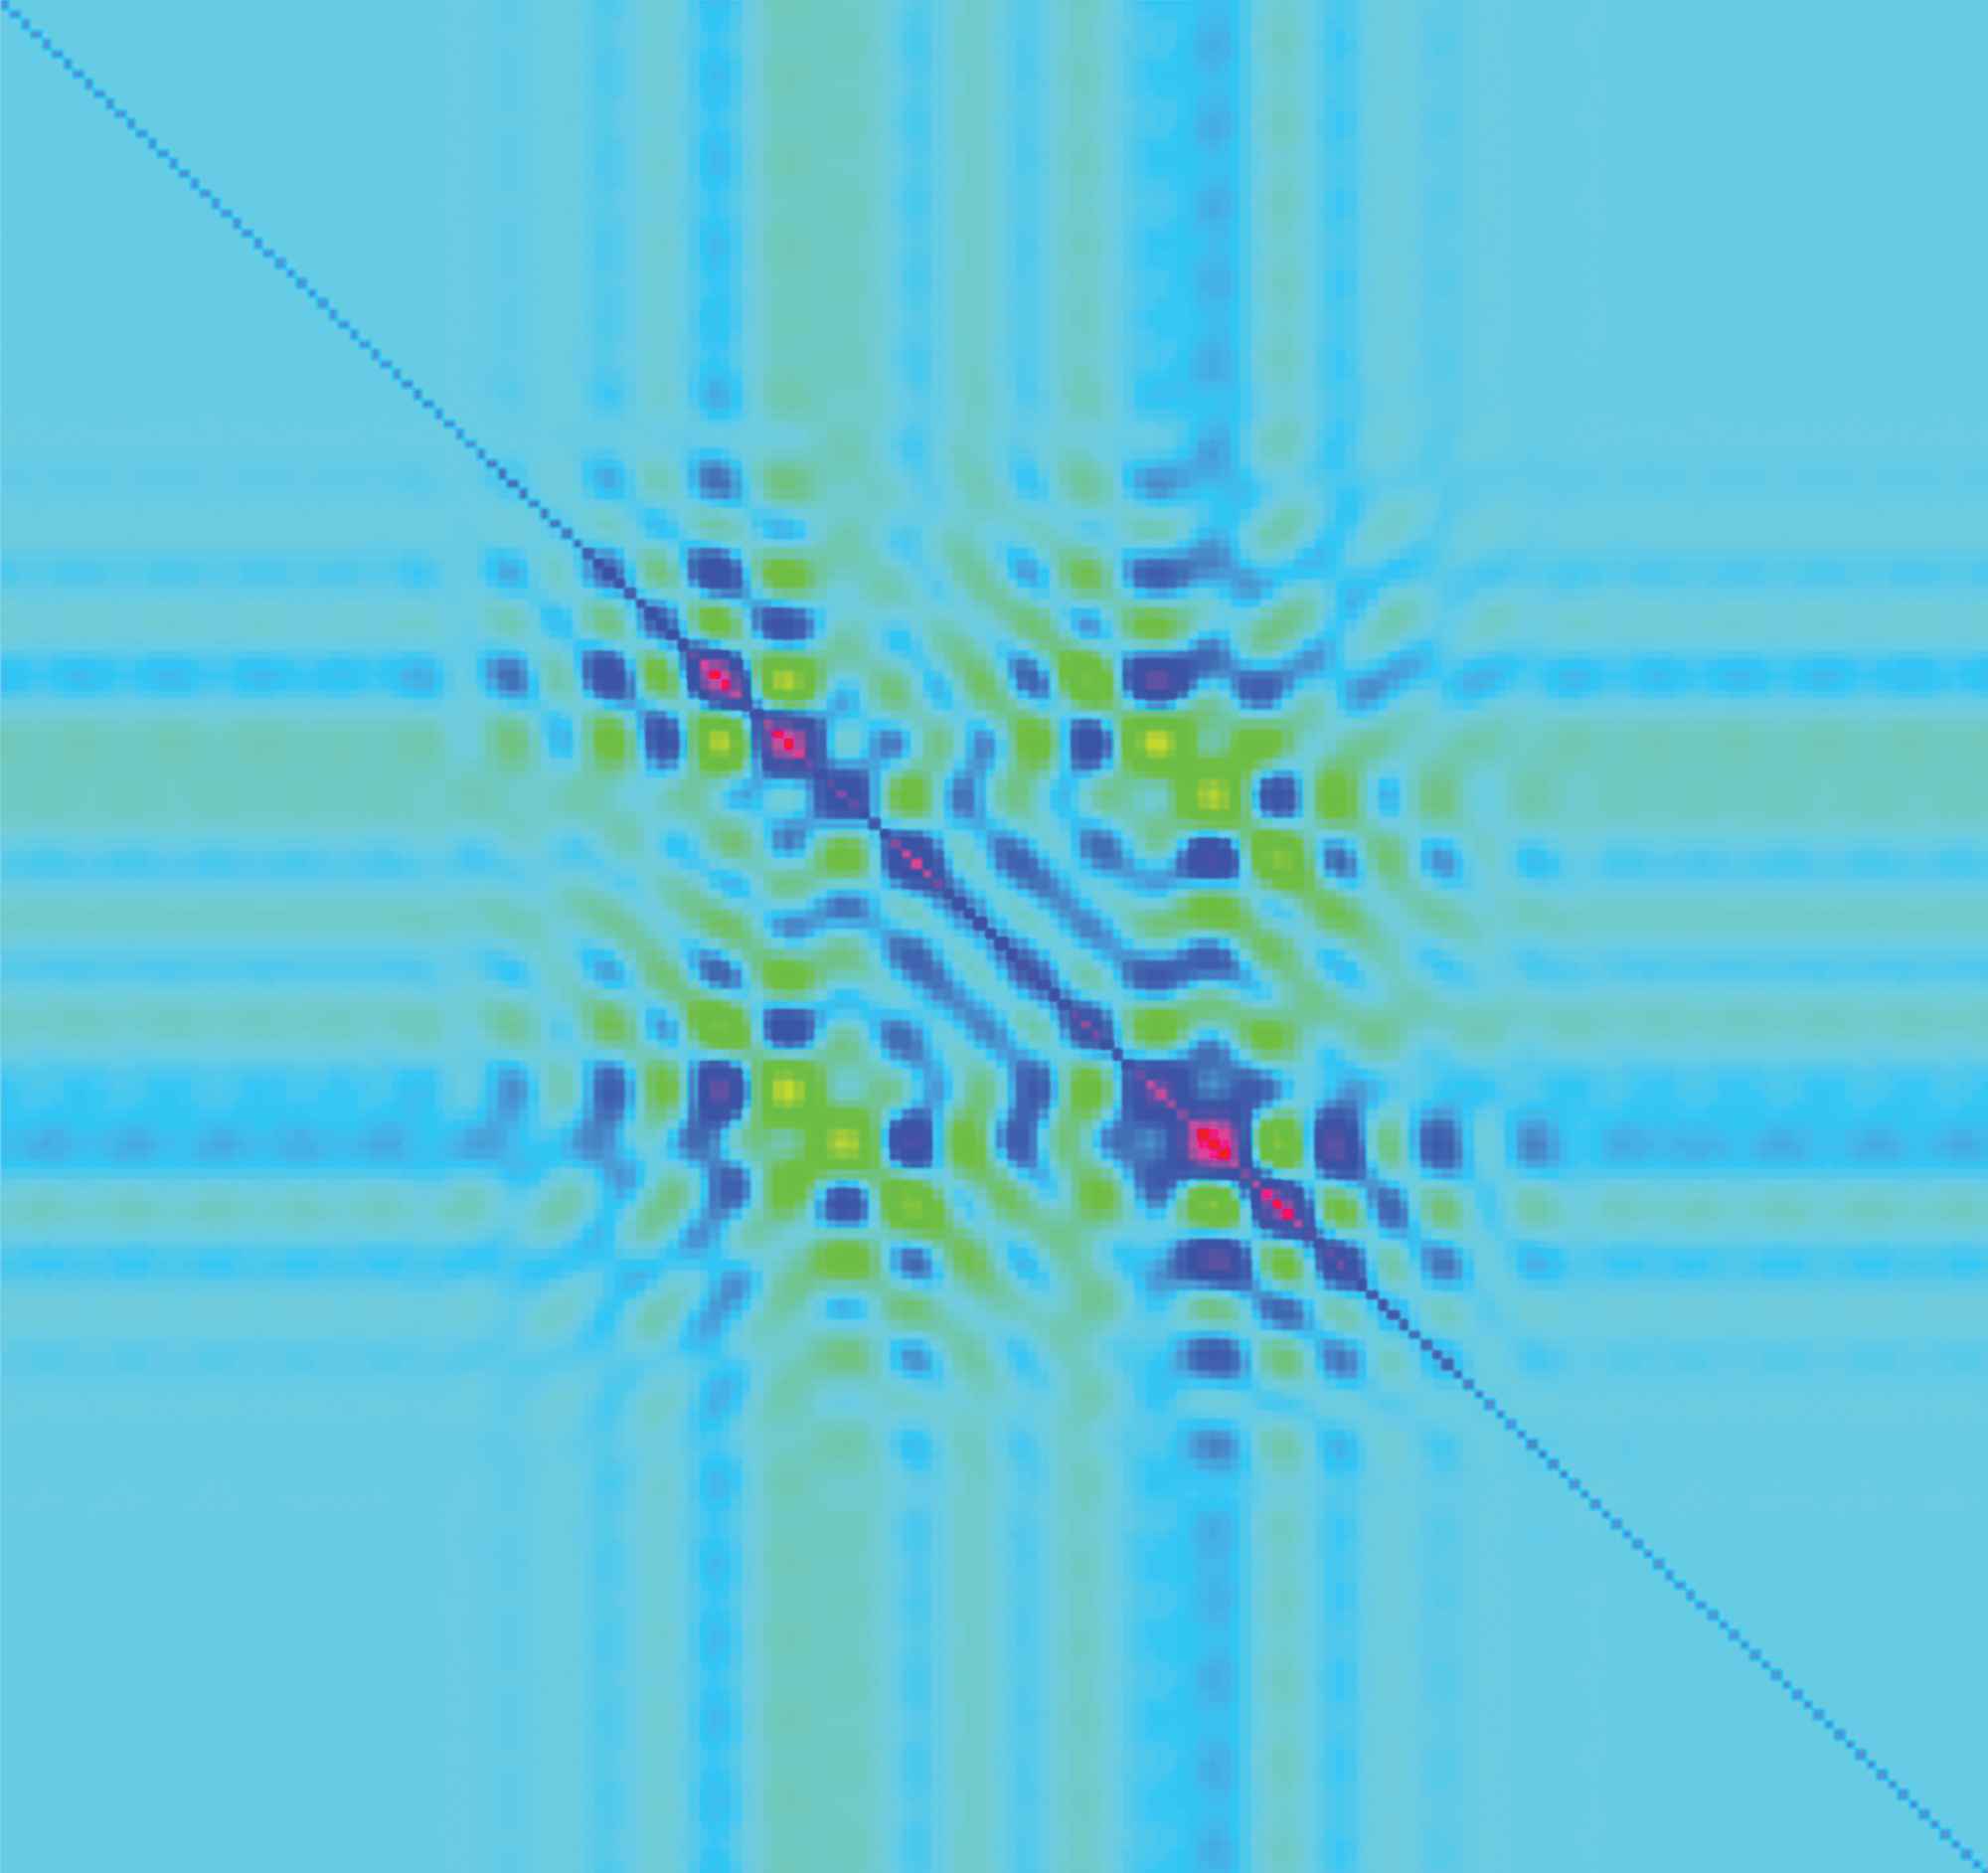
Images can help scientists visualize complex data. In this case, the patterns represent correlations among data taken while measuring a semiconductor device’s nanoscale features.
Today’s semiconductor industry depends on the performance of components that are just a few nanometers wide. Since the components are often too small to see using traditional microscopes, scientists need to get creative—in this case, by comparing experimental measurements with calculated values and seeing how well the values correlate.
Such NIST innovations directly impact the manufacturing of fast, mobile, and energy-efficient electronics.
Contacts
-
NIST Research Library & Museum(301) 975-3052