
Official websites use .gov
A .gov website belongs to an official government organization in the United States.
Secure .gov websites use HTTPS
A lock (
) or https:// means you’ve safely connected to the .gov website. Share sensitive information only on official, secure websites.
Classification Methods for the NIST Biorepository
Summary
We aim to identify chemometric fingerprints using artificial intelligence methods that reflect the temporal and geographic history of seabirds, and by extension their environment, to better understand trends in ocean and human health.
Description
Environmental samples collected in the Hawaiian Islands, Alaska, and Bering Sea locations are stored in the NIST Biorepository located at the Hollings Marine Laboratory in Charleston, SC.
NIST has been archiving biological and environmental specimens, including marine animal and environmental samples, for over 40 years. Currently, these biospecimens are stored at cryogenic temperatures in the NIST Biorepository located at the Hollings Marine Laboratory in Charleston, SC. Various chemical analyses of samples have also been performed and are cataloged in a corresponding database maintained by the Chemical Science Division’s (CSD) Biospecimen Science Group. This project broadly seeks to use modern advances in artificial intelligence (AI) and machine learning (ML) commonly employed by the CSD’s Chemical Informatics Group to identify scientifically relevant patterns in this chemometric data as it pertains to the health and wellbeing of both the environment and humans who interact with it.
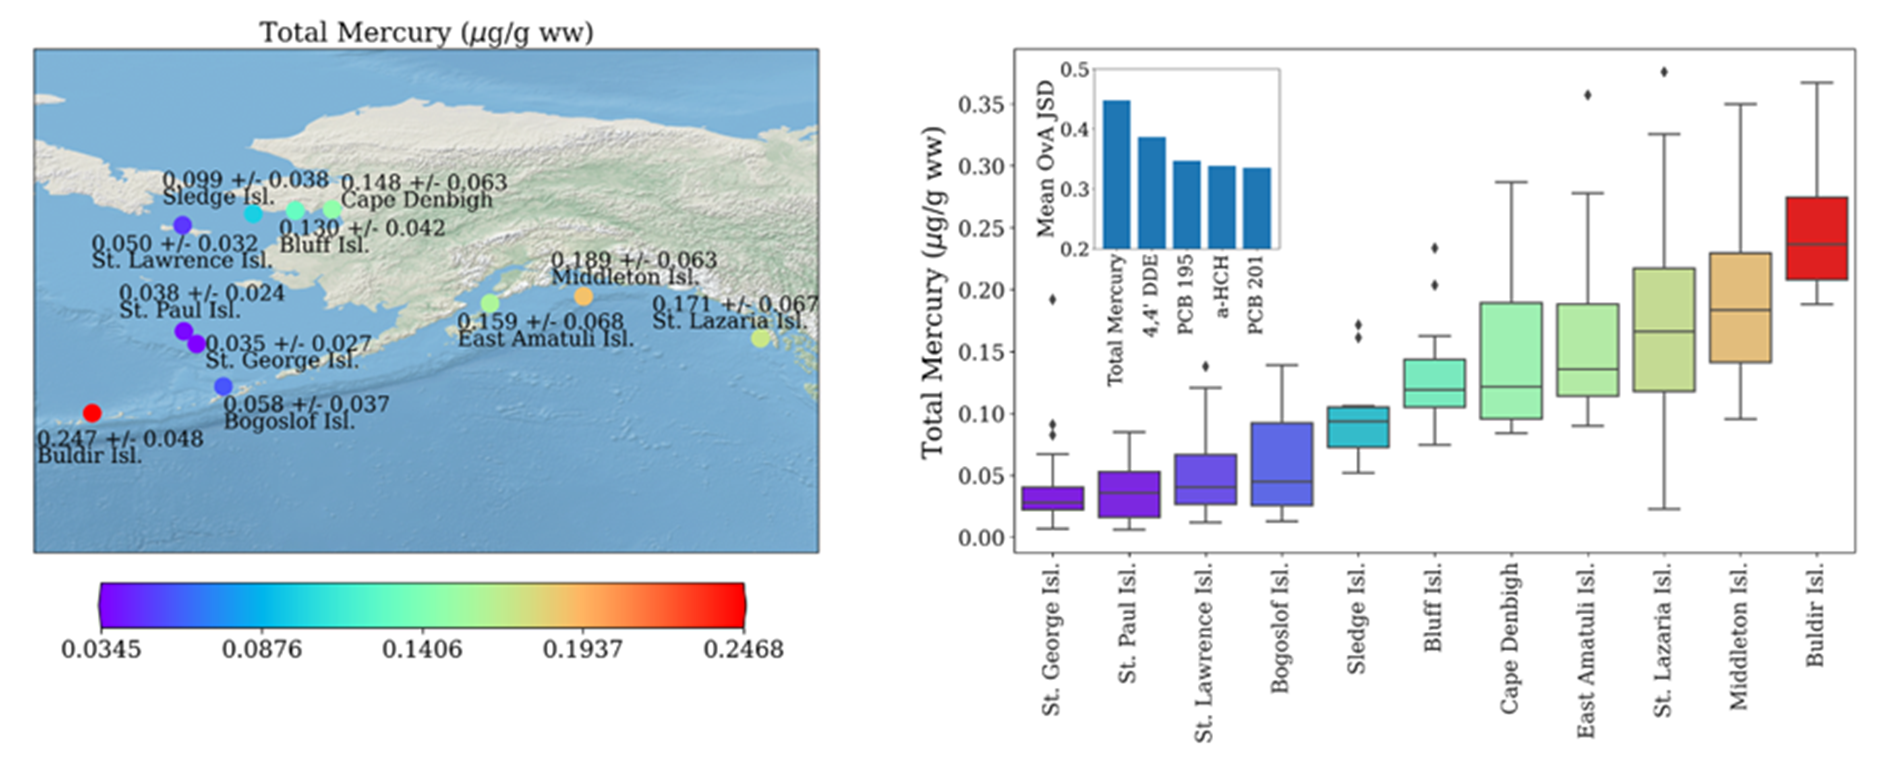
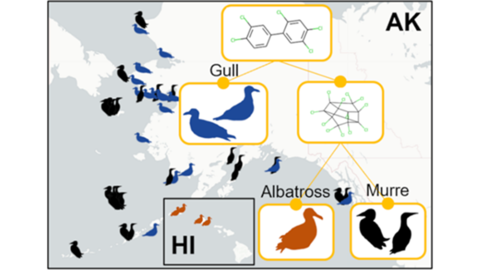
For example, the multi-stakeholder Seabird Tissue Archival and Monitoring Project (STAMP), a part of the NIST Biorepository, has collected eggs for more than twenty years to create a geospatial and temporal record of conditions throughout areas of the northern Pacific Ocean. The contents have been processed, archived, and selected aliquots analyzed to monitor ubiquitous contaminants and other analytes as these species are consuming the similar food as humans. In some areas, eggs are used as part of subsistence diet, serving a role in nutrition for indigenous peoples. Contaminant profiles in eggs are different across species. However, eggs are often not easily identifiable at the species level unless the bird is observed sitting on the nest representing a large point of uncertainty for wildlife managers and researchers alike. To address this issue, we have employed machine learning techniques to develop a chemometric classification scheme for seabirds represented in the STAMP collection. To date, these samples are covered by more than 50,000 individual data points representing seven contaminant classes, collated into a curated chemometric database linked to data describing sample origins. We developed various machine learning models to identify a bird’s genus, species, and geographic origin using only chemometric data. Our results suggest chemometric data, commonly generated as part of environmental monitoring efforts, likely provides sufficient information to enable identification of the genus, species, and geographic origin of tissue samples when manual identification is not possible.
Associated Publications
1. N. A. Mahynski, J. M. Ragland, S. S. Schuur, V. K. Shen, Building Interpretable Machine Learning Models to Identify Chemometric Trends in Seabirds of the North Pacific Ocean,” Environmental Science & Technology 56, 14361-14374 (2022).
2. N. A. Mahynski, J. M. Ragland, S. S. Schuur, R. Pugh, V. K. Shen, “Seabird Tissue Archival and Monitoring Project (STAMP) Data from 1999-2010,” J. Res. NIST 126, 126028 (2021).
3. Brinson, R. G., Elliott, K. W., Arbogast, L. W., Sheen, D. A., Giddens, J. P., Marino, J. P., and Delaglio, F., "Principal component analysis for automated classification of 2D spectra and interferograms of protein therapeutics: influence of noise, reconstruction details, and data preparation," Journal of Biomolecular Nmr, 74, 643-656 (2020).
4. Rocha, W. F. D., do Prado, C. B., and Blonder, N., "Comparison of Chemometric Problems in Food Analysis using Non-Linear Methods," Molecules, 25, (2020).
5. Sheen, D. A., Shen, V. K., Brinson, R. G., Arbogast, L. W., Marino, J. P., and Delaglio, F., "Chemometric outlier classification of 2D-NMR spectra to enable higher order structure characterization of protein therapeutics," Chemometrics and Intelligent Laboratory Systems, 199, (2020).
6. Onel, M., Beykal, B., Ferguson, K., Chiu, W. A., McDonald, T. J., Zhou, L., House, J. S., Wright, F. A., Sheen, D. A., Rusyn, I., and Pistikopoulos, E. N., "Grouping of complex substances using analytical chemistry data: A framework for quantitative evaluation and visualization," Plos One, 14, (2019).
7. Rocha, W. F. D., Sheen, D. A., and Bearden, D. W., "Classification of samples from NMR-based metabolomics using principal components analysis and partial least squares with uncertainty estimation," Analytical and Bioanalytical Chemistry, 410, 6305-6319 (2018).
8. Rocha, W. F. D., Schantz, M. M., Sheen, D. A., Chu, P. M., and Lippa, K. A., "Unsupervised classification of petroleum Certified Reference Materials and other fuels by chemometric analysis of gas chromatography-mass spectrometry data," Fuel, 197, 248-258 (2017).
9. Rocha, W. F. C. and Sheen, D. A., "Classification of biodegradable materials using QSAR modelling with uncertainty estimation," Sar and Qsar in Environmental Research, 27, 799-811 (2016).