
Official websites use .gov
A .gov website belongs to an official government organization in the United States.
Secure .gov websites use HTTPS
A lock (
) or https:// means you’ve safely connected to the .gov website. Share sensitive information only on official, secure websites.
New Device Design Brings Unparalleled Confidence to Cell Measurements
Direct uncertainty measurements are now possible in flow cytometry.
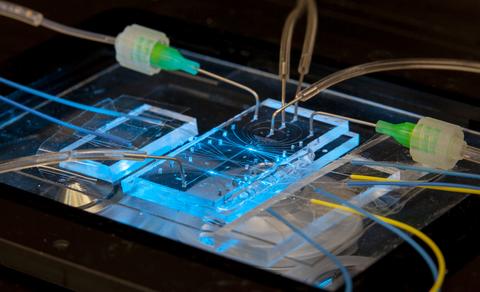
The cytometer chip is approximately 25 mm wide and 50 mm long (about 1 x 2 inches). The two bright blue spots are the points where the particles in the fluid are illuminated by laser light. Two fluorescence output signals from each point are carried off by fiber connections at right. There are five inputs at the top of the chip – one for the sample and four to create the fluid sheath.
Measuring the numbers and properties of cells moving in a stream — a process called flow cytometry — is critically important to diagnostic medicine, pharmaceutical research and biomedical science. Now researchers at the National Institute of Standards and Technology (NIST) have devised a way to make unprecedented improvements in the technique.
Flow cytometry typically entails marking cells with fluorescent material, shining laser light on them as they cross one particular point in a fluid channel about the size of a human hair — narrow enough that the cells generally move in single file — and recording the light emitted by the markers on the cell. Analyzing the emissions reveals various characteristics such as cell type, size, DNA content, and stage in the cell-division cycle.
But the conventional single-measurement method lacks a means to quantify the variations in its readings. For example, a cytometer that measures cancer biomarkers may use a specific measurement value to decide between healthy or diseased cells. One cell may return a slightly lower value, identifying it as healthy. But the range of values the instrument might return for repeated measurements of this cell is unknown.
That is problematic because it is not known how often the value might misrepresent the diagnosis. For example, high confidence is imperative when counting circulating tumor cells, which lead to cancer metastasis; there may be only one tumor cell for every million others in a blood sample. Improving the ability to resolve these rare events could lead to earlier detection and better treatment options.
Similarly, imprecise counts of different cell populations, such as immune cells, in a sample can lead to incorrect diagnosis of disease or misinterpretation of whether a drug treatment was successful. It can be hard to tell if different measurements arise from distinct cell types or simply experimental variability.
To address that situation, the NIST researchers created and validated a novel system that directly records the amount of variation in flow cytometry measurements to quantify uncertainty. Their instrument makes a series of multiple readings of the same particle whose position and velocity are exactly controlled as it moves in the channel, allowing them to observe measurement-dependent variations as low as 1%.
“This is the first time that we can directly measure per-object uncertainty in a flow cytometer,” said Matthew DiSalvo, lead author of the NIST team that reported its results on July 20, 2022, in the journal Lab on a Chip. “When you measure something once, and only once, you can’t verify the precision,” he said. “To do so, you need repeatability.”
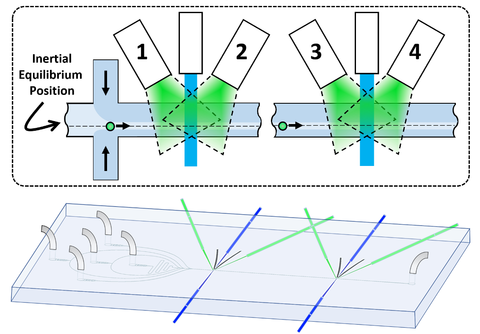
The new chip-scale serial flow cytometer addresses this problem by making four measurements of each particle: two readings at each of two different points separated by 16 millimeters; (about 0.6 inches) in the channel with flow rates as high as 100 or more particles per second.
Several critical challenges had to be overcome to create the new cytometer, which was initially tested using uniform plastic beads about 15 micrometers (µm, millionths of a meter) in diameter, around one-tenth the width of a human hair and the same size as average white blood cells.
One challenge was to fabricate a channel (about 40 µm by 80 µm) incorporating two identical zones at which laser light was applied to the passing particle and to ensure that the greatest amount of emitted fluorescent light was captured by a pair of detectors that measured in both upstream and downstream directions. To do so, DiSalvo and project leader Gregory Cooksey developed advanced waveguides that minimized loss and kept the emission light from spreading out. Cooksey has extensive experience in pioneering designs for microfluidics, and the cytometer team drew on that body of work.
Another, particularly demanding, challenge was finding a way to ensure that the emissions recorded at each of the two zones in the channel came from the same particle. That could only be done by controlling the particle’s position and velocity so exactly that the time of transit from one node to the other was precisely known, allowing the system to match the measurements at the first node with those at the second.
To do so, the researchers developed a “hybrid” technique for focusing the particle at a specific point in the channel. In conventional cytometers, this is usually done by using two different fluid pumps: One to inject the particles and one to create a separate sheath of fluid around the inside perimeter of the channel, in effect forming a liquid tube within the solid channel. That acts to confine the sample in the center core of the channel.
Or, at least, that is the presumption. But in fact, Cooksey said, in small channels “that’s the worst possible place you could put it.”
The reason is that the inertia of the fluid in small channels adds two forces on the particle. One force acts to lift the particle away from the wall. But another force pushes the particle away from the center of the channel because of the difference in fluid velocity acting on either side of the particle. As a result, the particle naturally tends to move off-center to an equilibrium position in which the forces are balanced. For the specific design used in this study, the displacement from the center line varies with the velocity of the fluid, from about 11 µm at 0.75 meters per second to 14 µm at 1.35 m/s.
To control that position very accurately, DiSalvo and Cooksey used four pumps to drive the sheath, allowing them to adjust the pressures from side to side as well as up and down. “We use the hydrodynamics to put the particle at the position we know it wants to go to at the very beginning of its transit,” DiSalvo said. “So when a particle accelerates down the channel, it’s already at its equilibrium position. That’s very tightly maintained for the whole length of the cytometer.”
Consequently, the device is able to make high-precision measurements with the particles moving at a high throughput velocity of 1 m/s. (1 m/s, or about 2.3 mph, may seem slow. But at that speed, a 10 µm particle is moving 100,000 times its body length per second. An automobile doing that would be traveling about 1 million mph.)
Since the experiments were reported in the new journal article, the team has been measuring white blood cells in the device. “The first thing we’ve been looking at is where the cell is in its division cycle,” Cooksey said. “We’re observing how much DNA is in the cell. The fluorescent signal lets us quantify how many of the cells are actively in the process of dividing, undergoing DNA synthesis.”
The researchers are also using different laser wavelengths to reveal different properties of the sample.
“We’ve modified the waveguides extensively to increase the sensitivity by incorporating microlenses and other improvements,” DiSalvo said. “We think we can soon provide uncertainty measurements while also matching the sensitivity of commercial single-measurement systems that cost hundreds of thousands of dollars.”
The cytometer project includes collaborators with expertise in mathematics and modeling, leading to additional new analytical methods that will improve quantification and classification. NIST researchers Paul Patrone and Anthony Kearsley have been using signals analysis to separate out measurement variations due to flow variations and particle size. Their methods also permit unparalleled ability to identify and separate objects that would have previously been too close together to distinguish in a conventional measurement. Failure to distinguish separate objects prevents accuracy in counting and could lead to missing unique sample components, such as circulating tumor cells or interacting immune cells.
Paper: DiSalvo, M. , Patrone, P. , Kearsley, A. and Cooksey, G. Serial flow cytometry in an inertial focusing optofluidic microchip for direct assessment of measurement variations. Lab on A Chip. Published 20 Jul 2022. DOI: 10.1039/D1LC01169C